


Doji Patterns
Types of doji candles are quite vast, but the thing that matters is how traders interpret them, depending on their shapes and where in the chart a doji pattern emerges. Candlestick patterns are one of the most important yet very easy price action techniques to learn. It's not enough, but it's essential for each trader to know the different types of doji candles. For any kind of trading method with any different technical approach, learning the candlesticks and specifically multiple types of doji candles is a must. These candles allow traders to increase their efficiency in forex trading by helping them to optimize their precision on their entries and exits from a trade, along with the longevity of holding their trades or even preventing them from entering the trade. Candlestick patterns, and specifically doji candles, are like guiding lights in the financial markets, helping traders to make informed decisions.
What Are Doji Patterns?
Types of doji candles, as mentioned above, come in a variety of forms and, based on the way they are interpreted, can be organized into different types. But generally speaking, doji patterns show indecision in the markets. It means that neither buyers nor sellers were able to overcome one another. Doji is a candlestick pattern, and it is a result of a candle whose open and close are roughly equal; this results in a candlestick with a small body. This candle might have a long upper shadow and a short lower shadow; also, it can be vice versa, so in doji patterns, the length of the upper and lower shadows can vary. Doji patterns also reflect the psychological state of market participants. They highlight moments when traders are uncertain about the future direction of prices. Also, it's important to mention that the placement of a doji within a chart is very important. A doji at the end of a bullish movement has a different meaning than a doji at the end of a bearish momentum. We will further investigate these topics throughout this article.
Different Types of Doji Candles
Types of doji candles are usually categorized into 5 different types based on their shape and position in the chart.
-
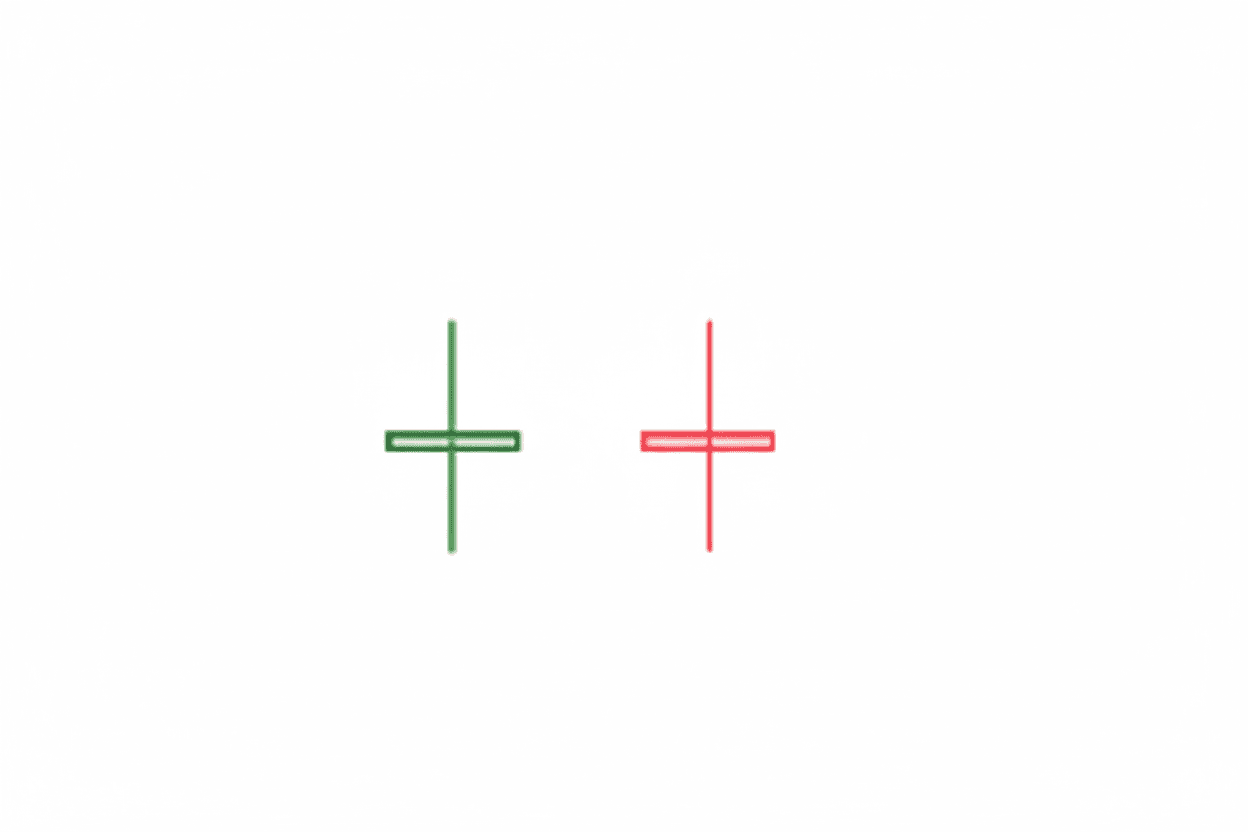
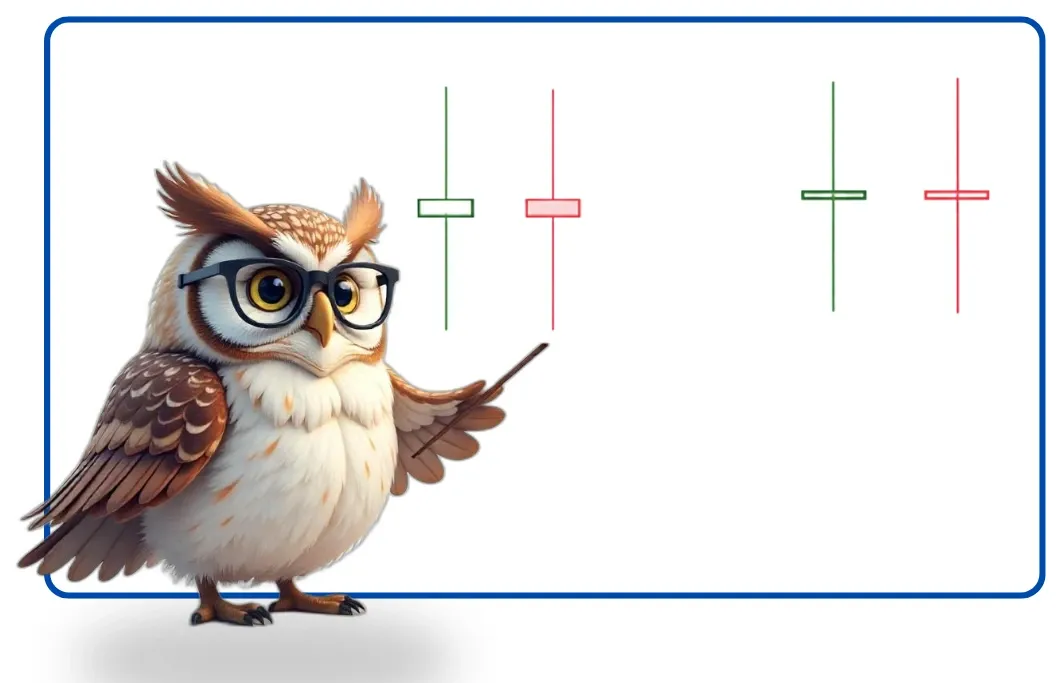
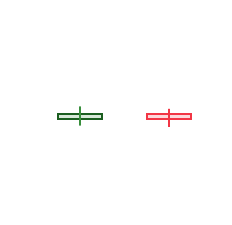
Standard doji:
This is the most common doji pattern, which is a candle with relatively even wicks and a small body at the middle of the candle. This pattern signifies a state of equilibrium, the essence of indecision in the markets.
-
Long-Legged Doji:
This candle has long upper and lower wicks (shadows) showing significant price movement but closing near the open price. This means high volatility and uncertainty in the market.
-
Dragonfly doji:
This type has a long lower shadow with little to no upper wick; it's like that open, close, and high prices are almost the same.
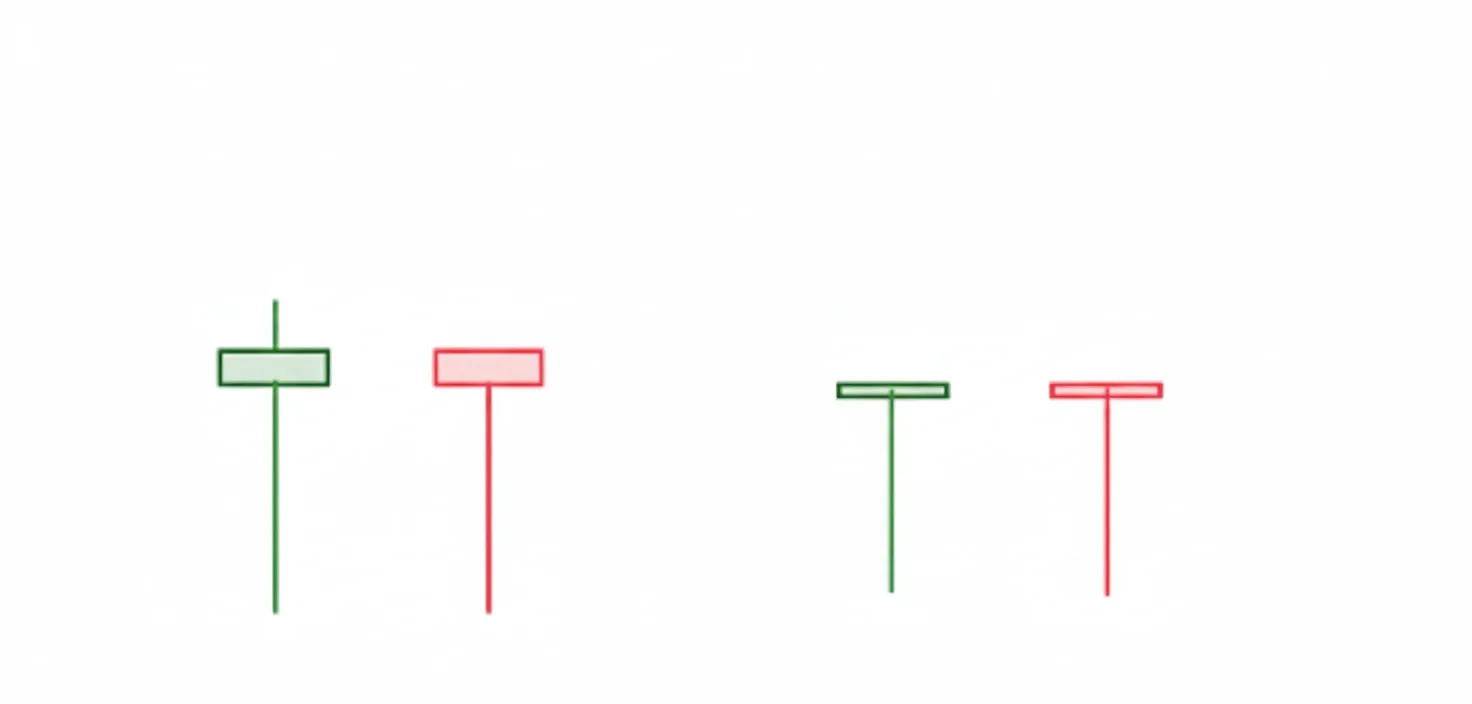
This type of doji candle can be a signal for market reversal if seen at the end of bearish momentum. telling that this might be the end of the bearish trend and time to start a bullish trend.
-
Gravestone doji:
Just like the dragonfly pattern but vice versa, this type has a long upper shadow with little to no lower wick; it's like that open, close, and low prices are almost the same.
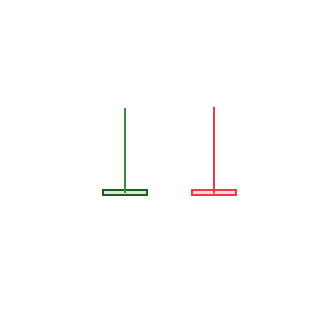
This type of doji candle can be a signal for market reversal if seen at the end of bullish momentum, indicating that this might be the end of the bullish trend and time to start a bearish trend.
-
Four-Price doji:
This is the rarest pattern among different types of doji candles. In this pattern, the open, close, high, and low prices are all the same, which makes the doji look like a flat line.
This pattern represents a completely flat market with no volatility and can only be seen in low-liquidity markets. Traders should ignore it unless it is followed by a strong price movement.
How To Trade Doji Patterns
The doji carries crucial information about the balance (or imbalance) between buyers and sellers; doji candlesticks can be a sign of 3 different market situations based on their position in the chart:
-
They can be a sign of potential reversal when they appear after an uptrend or downtrend. In this situation, a doji is signaling that the previous dominant force (buyers in a bullish movement and sellers in a bearish movement) is losing momentum, and the other side is trying to dominate the market.
-
They can act as a confirmation of a support or resistance level; forming a doji candle near a strong support or resistance level can add weight to the validity of that level, showing traders that the market is going to respect these levels and is not going to break through them.
-
It can also be a sign of trend weakening; it might not lead to immediate trend reversal, or it might not be near a support or resistance level, but it's just trying to show that traders are having doubts and the market is entering a state of equilibrium.
Note that a doji candle by itself is not a trade signal, and you should always rely on other technical tools and techniques along with a doji candle to execute your trades.
The most important thing for using a doji candle is to identify the current market trend; as mentioned earlier, seeing a doji pattern at the end of a bullish trend can lead to a reversal, and a doji pattern at the end of a bearish trend can result in a trend reversal and the start of a new trend, so you must be able to identify and recognize the trends correctly and be able to recognize if it’s the end of a trend or if the market is currently in the middle of a trend.
The next step is to wait for the confirmation with the next candle; as explained, a doji represents indecision between buyers and sellers; therefore, traders should wait for the next candle to see which side has won and is now trying to dominate the market. This matter relies on knowing all of the candlestick patterns; for instance, if a bullish candle (marabuzo) follows a dragonfly doji, it can confirm that the new bullish trend has started. But to add assurance, make sure that you are seeing these patterns in a support or resistance zone; then execute trades based on this signal.
Another tool to strengthen your trade decisions is using technical indicators along with doji patterns as a complement. But the best indicators to use along with doji patterns are:
-
Moving Averages: A doji near a major moving average can be a sign of reversal.
-
Relative Strength Index (RSI): When the RSI indicator is in the oversold or overbought zone, it indicates that the market might have started to think about a reversal, and if you see a doji candle at a support or resistance level, then you have multiple confirmations, making it a solid strategy for your trades.
-
Volume: Also remember that a doji that has higher volume can suggest that it will have a higher impact, making it more important than a regular mid-trend doji.
