


Candlestick Patterns

Forex trading requires multiple skills. One of them, and some might say the most important one, is technical analysis. The method utilizes historical price movements and patterns from the past to forecast future market trends. Based on this knowledge, you can identify your entry levels, set a stop loss and take profit for your trades, calculate your risk per trade, and then execute the trade.
There are countless TA (technical analysis) methods. Anyone can do some research and, based on their preferences, choose or even create their own unique trading strategy. But the one thing that is common in almost every technical analysis strategy is candlestick patterns.
Candlestick patterns can be incorporated perfectly in any trader’s strategy, making them the first step in learning technical analysis. Just like price action, that is the root from which many other strategies have grown. Most of the trading strategies are based on candlestick patterns. Usually, traders use these as forex confirmation candles. In order to utilize these patterns in our trading journey, we should start by familiarizing ourselves with the candlesticks themselves.
What Is a Candlestick?
Candlestick is used widely in forex trading, and you might have heard it more than anything else in the trading world. But have you ever wondered what a candlestick is?
 |
These green and red objects, which you can set to any color of your choosing, are known as candlesticks, as you can see in the photo. Undoubtedly, each candlestick possesses a unique shape, style, and size. Each of these candles provides traders with multiple data, like exact prices of open, close, high, and low. |
Candles are market language; markets speak to traders using candlesticks
What is the Time Frame?
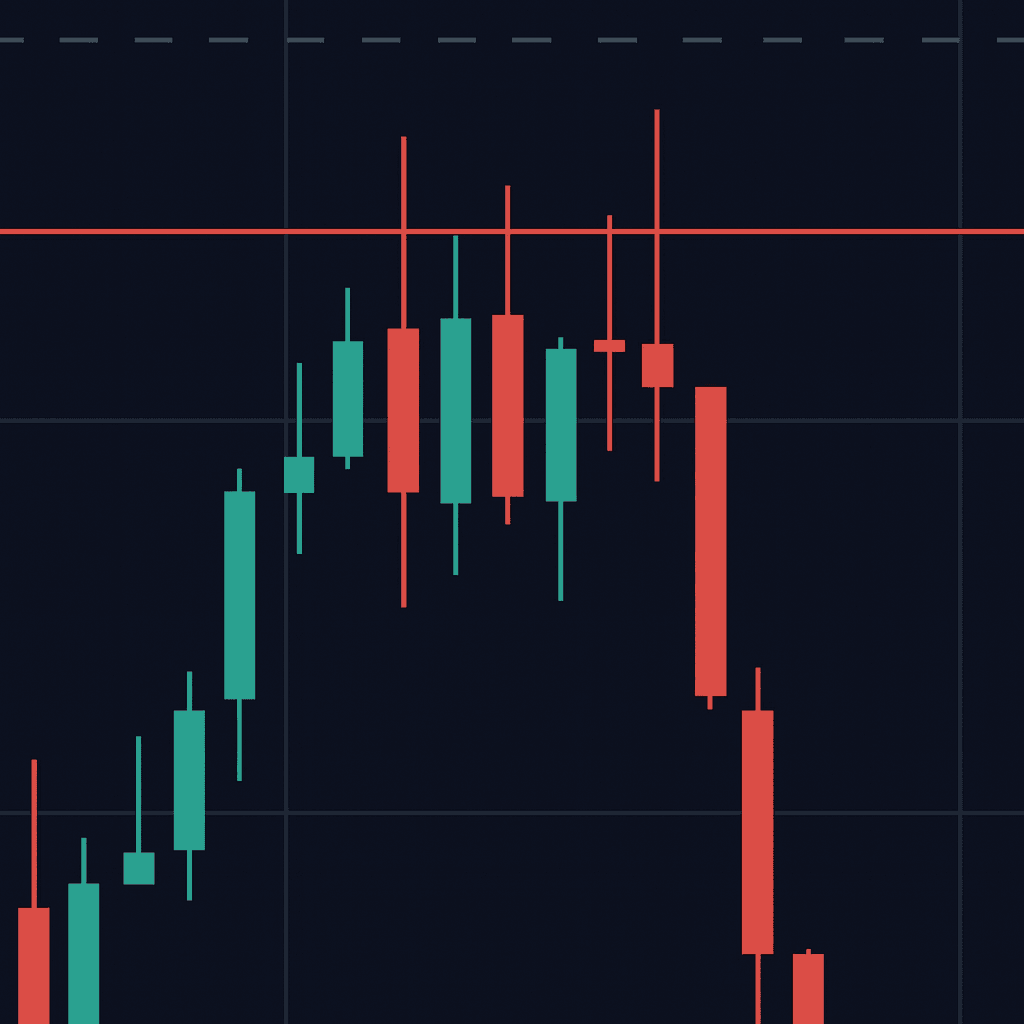
Buyers and sellers are fighting 24/5 in the forex market; they are pushing prices upward and downward nonstop, but as traders, in order to make data-driven decisions, we need to have access to the result or an outcome of this battle. Therefore, as intraday traders, we must determine what we want to see as the outcome of this battle over a specific time frame. Who was the winner? Who emerged victorious, the buyers or the sellers? What was the result? How far were they ahead of the competition? For ba etter explanation, we must first talk about a concept called time frame in forex trading. Depending on their trading strategy, traders select a time frame such as 5 minutes, 1 hour, 4 hours, or daily. This involves observing charts where each candle opens and closes within a specific time frame. For example, on a 5-minute chart, candles will be open and then closed one by one every 5 minutes. In the Mishov Markets trading platform, there is a tool called Forex Candle Timer that shows the remaining time in each time frame for candlestick closures. (for more information on time frames, click here.)
What are Bullish and Bearish Candlesticks?
Candlesticks provide information on the opening and closing prices of each candle, as well as the highest and lowest prices within the selected time frame. Based on the open and close price of each candle, we are to separate candles into two categories: bullish and bearish. In this image, as well as most trading or charting platforms, we depict these candles in green and red, with green representing bullishness and red representing bearishness. When the close price is higher than the open price, it means that during that specific candle, the market experienced a price increase, giving us a bullish signal. Therefore, it is represented in green and labeled as a bullish candle. And whenever the close price is lower than the open price, it means that during the selected time frame the market price has decreased, and it has given a bearish signal, therefore showing it in red and calling it a bearish candle.
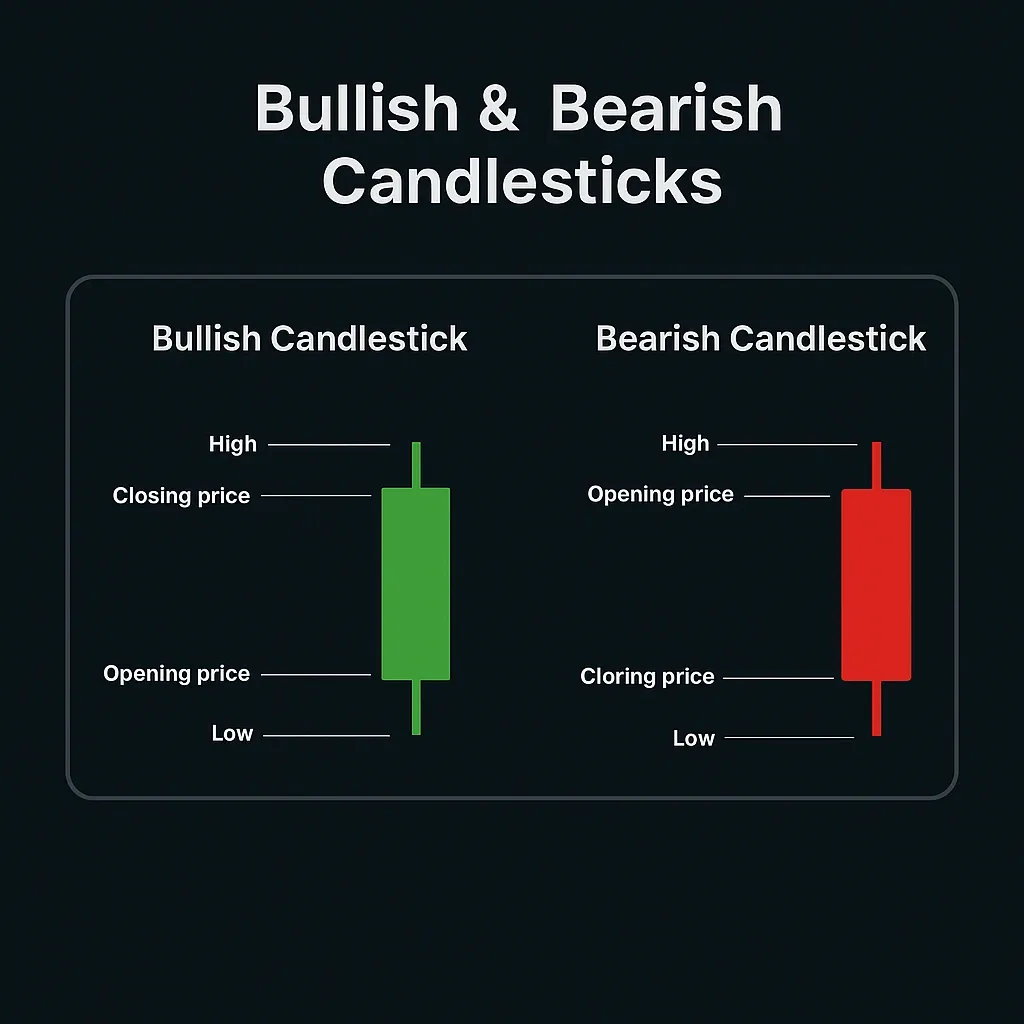
Each candle has 2 parts: main body and wick, also known as shadow. Usually shown as a rectangle, the main body represents the distance between open and close prices. The wick is the distance between the highest price of candle and the closing price in bullish candles and the opening price in bearish candles. Also, wick exists at the bottom of each candle and is the distance between the lowest price of the candle and the opening price in bullish candles and the closing price in bearish candles. When a wick is longer than usual, it is referred to as a shadow. Like the one you see in the picture below.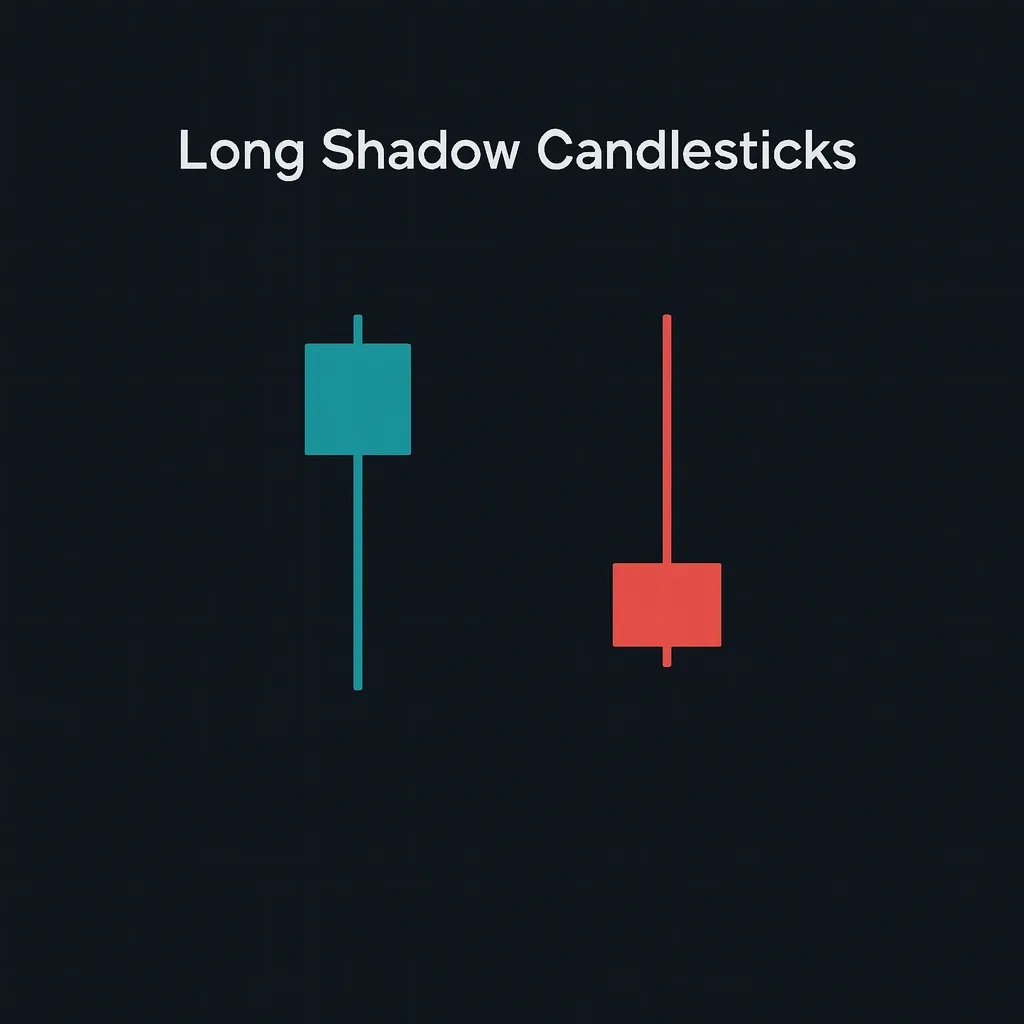
Knowing that in forex trading, candlestick patterns are one of the first things that can provide you insights about market sentiments is crucial; therefore, they should be used by any trader at least as forex confirmation candles.
What are Candlestick Patterns?
Every candlestick conveys a message, and each movement or shape reflects the market sentiment. They can be categorized into 3 main types: revesrsal patterns, continuation patterns, and indecision patterns.
-
Reversal candlestick patterns: these kinds of patterns indicate potential directional change in the trend.
-
Continuation candlestick patterns: these patterns indicate that the current trend may continue in the same direction.
-
Indecision candlestick patterns: these candlesticks often suggest uncertainty in the market and signals that the market has not yet made a decision and traders should remain patient.
We will delve into each category further, but first we need to learn the candlestick language. As mentioned earlier, each candle has a unique shape. Even with a comprehensive understanding of candlestick patterns, it remains challenging to identify two identical candles with identical shapes and measurements. Even if you manage to locate one, their placement within the trend may indicate a completely different pattern. Therefore, it's crucial to understand their language, and once a pattern emerges, you can decide whether to act on it or not.
I’ll try to explain it using examples:
Consider a chart with a 1-minute time frame; as previously explained, each candle will open, move upwards and downwards, and then close at the conclusion of the minute. This price movement within each candle has a lot to say, and traders, regardless of their strategy or edge, should all learn to speak in the language of candles. The size of a candlestick body, along with its wicks and whether it is bullish or bearish, can indicate its strength, weakness, neutrality, reversal, and continuity in trend. But what about themselves? What are candlesticks telling us?
They are simply telling us what other traders from all around the world are doing.
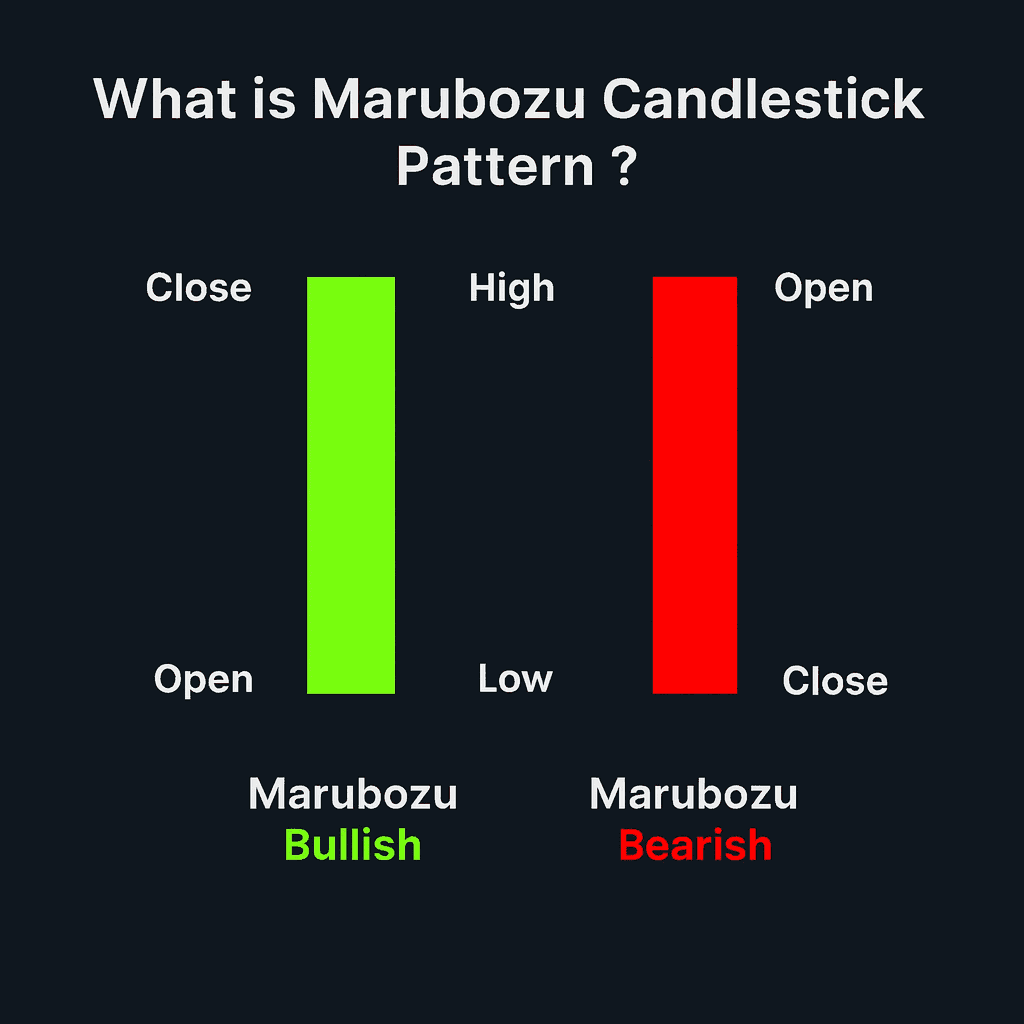
When a bullish candlestick opens, it presents countless possibilities and a significant number of "ticks," so you cannot and shouldn't make any predictions until the candle has been closed. But if, as soon as the candle opens, prices start hiking until it closes, then we will have a candle that has no wicks and it has only a body. These kinds of candlesticks, also known as MARUBOZU, are known to represent a full conviction of buyers inside the market, which means no majority of traders were sellers and all buy orders were filled and kept pushing forward within the specified time frame. Depending on where the candle falls within a trend, it can be interpreted differently.Generally, it indicates that buyers hold the power. Conversely, the same applies to a bearish MARUBOZU candlestick pattern.
Let's delve deeper and face a more complicated candlestick. When a candle opens, its price initially rises, but sellers intervene and lower it further. Then, buyers regain control, pushing the price higher until the end of the one-minute time frame. The candle then closes at a price close to its opening price, resulting in a small body and long wicks. When the wicks at both ends align, we refer to these candlesticks as DOJIs. We typically interpret them as a neutral market situation, indicating that buyers and sellers were unable to reach a consensus and ultimately settled for a draw in the 1-minute candlestick. There are more candles like shooting star and hammer, but we will dive in them later.
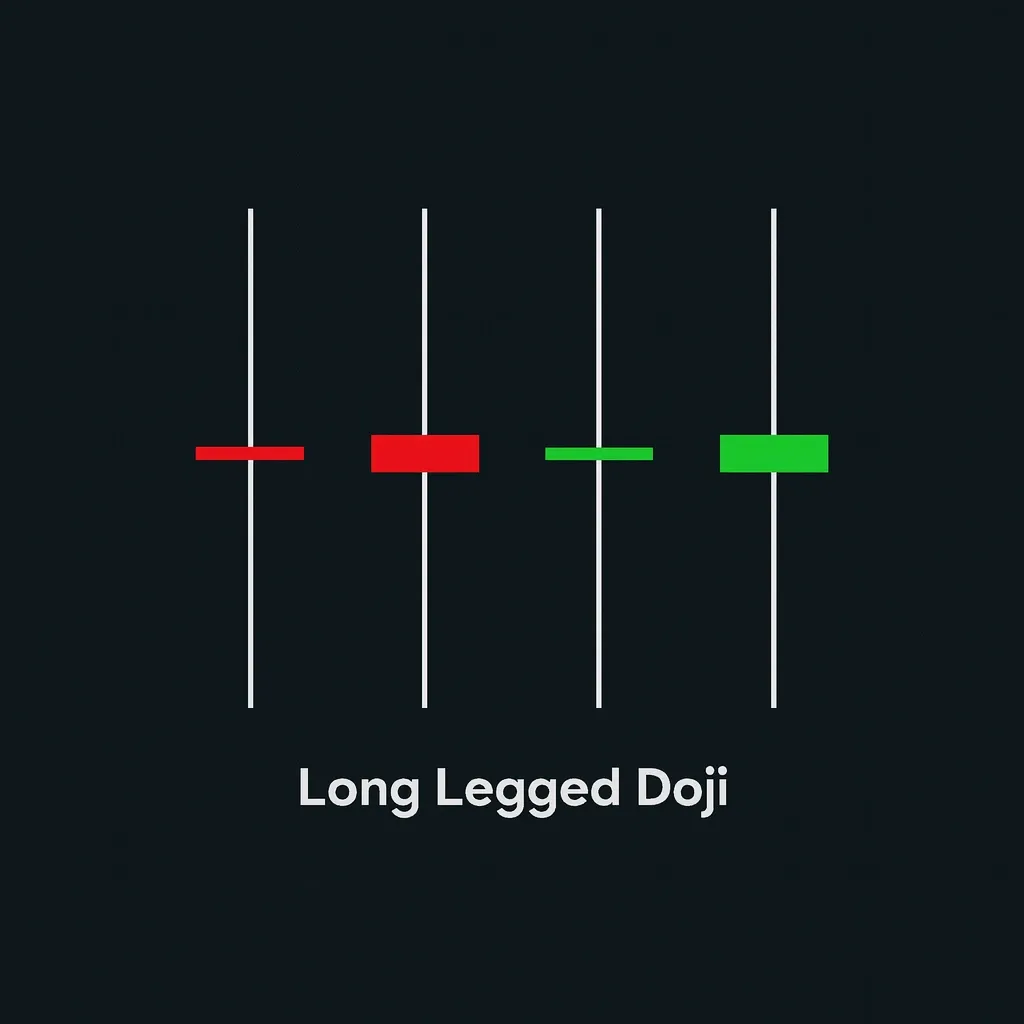
Now, let's emphasize the section we previously discussed. Even in doji candles, there are multiple types that have a different meaning based on their placement in a trend.

As you can see in the picture above, we have standard doji, long-legged doji, dragonfly doji, gravestone doji, and four price doji. Every single one of these has a different meaning, which we will discuss later.
