


Shooting Star & Hammer

Shooting star and hammer candlestick patterns are one of the most important and powerful patterns that exist in financial markets. Trading requires solid knowledge of candlestick patterns. These two are the most reliable candle stick patterns for reversal signs and are the main foundation of forex confirmation candles. As mentioned in the CANDLESTICK PATTEERNS 101 article, we must learn candle language. In this article, we will delve deeper into these Japanese candlestick patterns and learn their language. Fear not, its not Japanese, though I like to call it "Candlese,” and its quite easy to learn.
Shooting Star Candle Stick Pattern
First and foremost, this pattern is valuable at the end of an uptrend; it means unless you see these candles at the end of an uptrend and in your predetermined resistance zone, you shouldn't take them into consideration. These candles are showing traders that either they should exit their long trades or be prepared to enter their short trades.
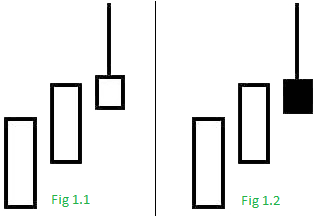
These are the shooting star candles. As shown in Figure 1, the prices have risen within the specific time frame, and then sellers gained power and pushed the price down, which in Fig. 1.1 they weren't able to bring prices lower than the candle’s open price, which has led to the candle being bullish. But in Fig. 1.2, sellers were more powerful, which pushed the price below the candle’s open price and led to a bearish candle. There are many different interpretations on this matter that being bearish or bullish doesn’t matter, but in Candlese language, this pattern is trying to tell us that fig. 1.2, which is a bearish candle, has more downtrend power. Therefore, its better that traders count bearish candles as a stronger Shooting star pattern.
Features of a Shooting Star Pattern
-
In the shooting star candlestick pattern, the shape of the body should look like a square.
-
The length of the upper shadow must be at least twice as long as the body size.
-
Its better that in a shooting star pattern we don’t see a lower shadow, or if there is some, it should be quiet a small lower wick that is barely visible.
-
A close below the low of the shooting star candle should confirm the bearish movement in the next candle.
-
The colour of the body does not make a huge difference, but it's better to look for a bearish candle in a shooting star candlestick.
Hammer Candlestick pattern
Traders can act on this pattern, which is valuable at the end of a downtrend and in the predetermined support zone, unlike the shooting star pattern. These candles are showing traders that they should either exit their short trades or enter their long trades in specified support zones.
As shown in Figure 2, these candlesticks are known as the hammer because of their shape, which is identical to a hammer. The hammer candle stick pattern is considered a bullish candle and must be seen at the end of a downtrend to be considered bullish. If you saw them at the end of the uptrend, they are no longer hammer, in this situation, these candles are called Hanging Man patterns.
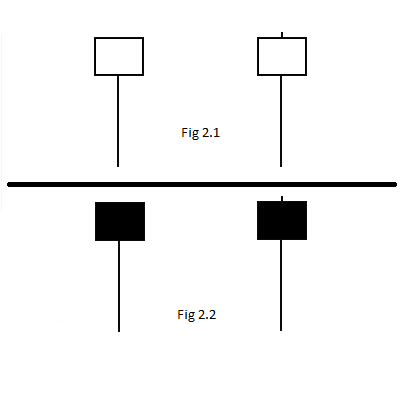
These candles are telling us that at the open of the candle in the specific time frame, sellers empowered prices to go downward, but then buyers came in and pushed the price higher, near the open of the candle (Fig. 2.2) and even perhaps higher than the open price of the candle (Fig. 2.1), which is telling us in “Candlese” that buyers were able to overcome the seller and gain control of the market. Hammer tells us to get ready for Long position.
Features of the Hammer Candlestick Pattern
-
In the HAMMER candlestick pattern, the shape of the body should look like a square
-
The length of the lower shadow must be at least twice as long as the body size.
-
It's better that in a hammer pattern we don’t see an upper wick (shadow), or if there is some, it should be very small, in other words, a wick that is barely visible.
-
A close above the high of the hammer candle should confirm the bullish movement in the next candle.
-
The colour of the body does not make a huge difference, but it's better to look for a bullish candle for a hammer candlestick.
Hanging Man and Inverted Hammer Candlestick Pattern
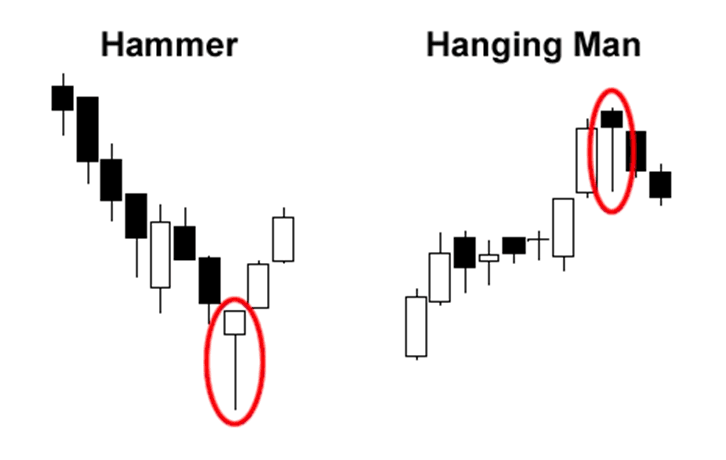
Other than hammer and shooting star patterns, which look similar, there are two more patterns with the same look but with different meanings; these two are hanging man and inverted hammer; the only difference is that these candles position in the trend. For example, if you see a hammer candle at the end of an uptrend and in a resistance zone, then its called Hanging Man. Also, if you see a shooting star candlestick at the end of a downtrend and inside the support zone, then its called an Inverted Hammer. Inverted hammer is saying that my long upper shadow means that buyers tried to reverse the market and increase the prices. Also, Hanging Man is telling the same story in vice versa, but it happens at the end of an uptrend and in a resistance zone, suggesting that sellers tried to reverse the trend by pushing prices lower.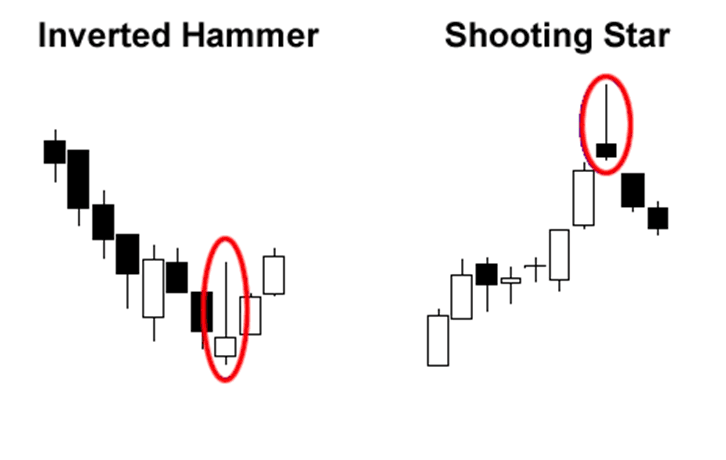
 but these two have a lower impact and are less effective If you have already learned the candlestick language, you should know that prices after the inverted hammer and hanging man have increased or decreased to where they were, and sellers or buyers weren't that powerful; therefore, its a must to wait for the next candle close and confirmation of the reversal.
