


The Amount of Money in the World

The money flow and the amount of money in the world are two definitions that relate to comprehending the government's cash management because it is a major player in the money supply in each country and so worldwide. Government Cash management can be defined as “…having the right amount of money in the right place and at the right time to meet the government’s obligations in the most cost-effective way” (Storkey, British economist - 2003). Mike Williams (an independent consultant specializing in government debt management, advised governments on this issue in 2004) describes the Government Cash management as “the strategy and associated processes for managing cost effectively the government’s short-term cash flows and cash balances, both within government, and between government and other sectors”. A definition proposed by Storkey (2003) is the essence of effective cash management.
In the world financial markets, the most famous currencies which have the highest liquidity are the US Dollar (USD), Euro (EUR), Japanese Yen (JPY), and Australian Dollar (AUD). These currencies are essential to global trading and finance. Their availability allows for quick buying and selling, making them the go-to options for many investors and traders. The US Dollar (USD), Euro (EUR), Japanese Yen (JPY), and Australian Dollar (AUD) are the most famous currencies with the highest liquidity. They are crucial to global finance and trading activities. Their liquidities allow easy transactions like buy and sell; so, it means that they prepare opportunities for many investors and traders to be active in the market. Because of the high impact on global financial policies and strategies, all governments and central banks carefully monitor these currencies.
Since they are widely used in the financial world, they are more available to use by business firms and even individuals. It means that market trends in these currencies can easily impact everyday economics activities. Prices of imports and exports may fluctuate based on currency value changes, affecting consumers and businesses alike. The interconnected nature of these currencies causes their vital playing role in shaping both global and local economic settings.

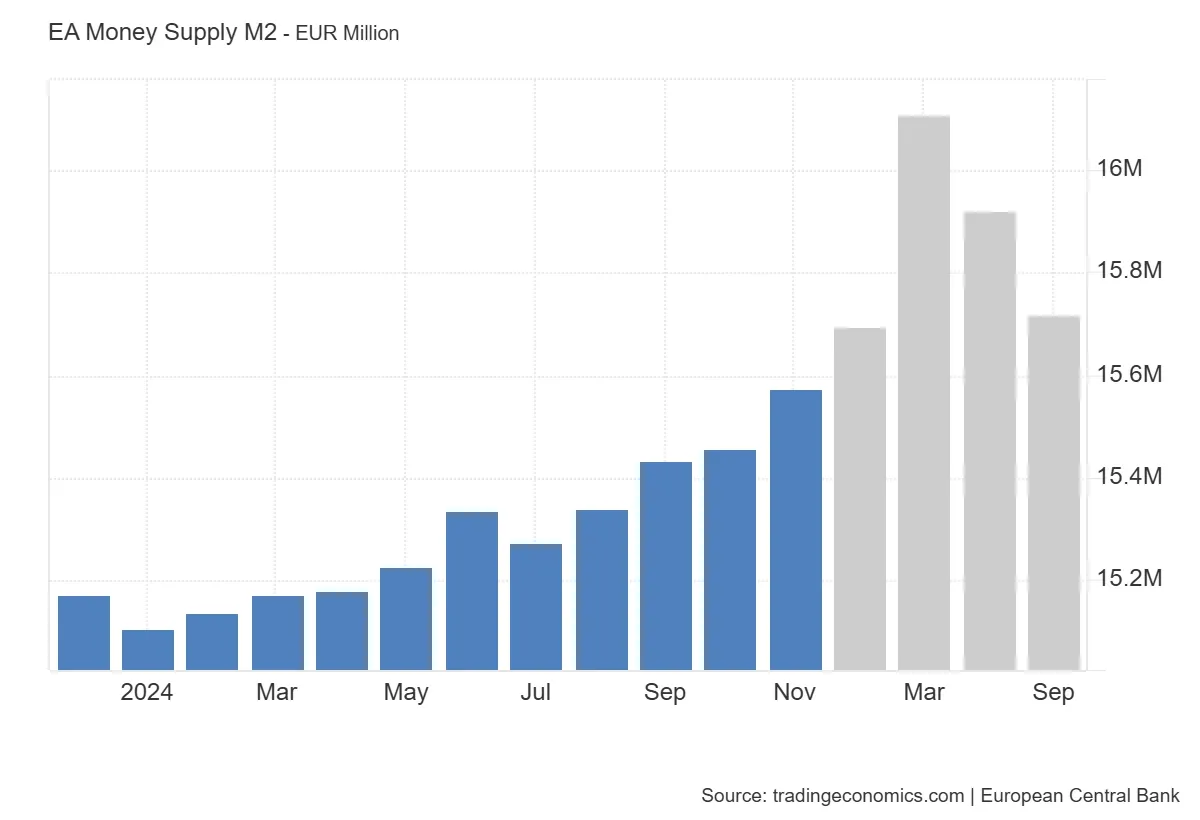
Analysis team from Trading Economics said the money supply in the EU area measured as M2 and showed a noticeable increase to the total of 15,421,337 million Euro in October 2024. By the following month, November, it increased again and reached 15,540,007 million Euro; which all indicate a solid upward trend in money supply during this period. Looking ahead, projections suggest that by the end of the quarter, the money supply will likely grow further to approximately 16,070,480 million EUR.
When examining the long-term data from 1980 to 2024, the average money supply in the Euro Area stands at 6,202,599 million EUR. The figures reveal a significant growth trajectory over the decades. For instance, November 2024 marked a historical peak for the money supply at 15,540,007 million EUR. In contrast, January 1980 recorded the lowest money supply at just 1,070,496 million EUR. This illustrates the substantial expansion of money supply in the Euro Area over the years. Our econometric models forecast that by 2026, the money supply in the Euro Area will trend towards 15,262,950 million EUR. This future projection indicates a continuation of the growth observed in recent years. The data highlights the dynamic nature of the Euro Area's economy and its monetary policies over time.
M2 is an important concept in understanding the money supply within an economy. It serves as a measure that includes various forms of money, specifically cash, checking accounts, and other types of deposits that can easily be converted into cash. Certificates of deposit are time-bound savings accounts that often provide higher interest rates.
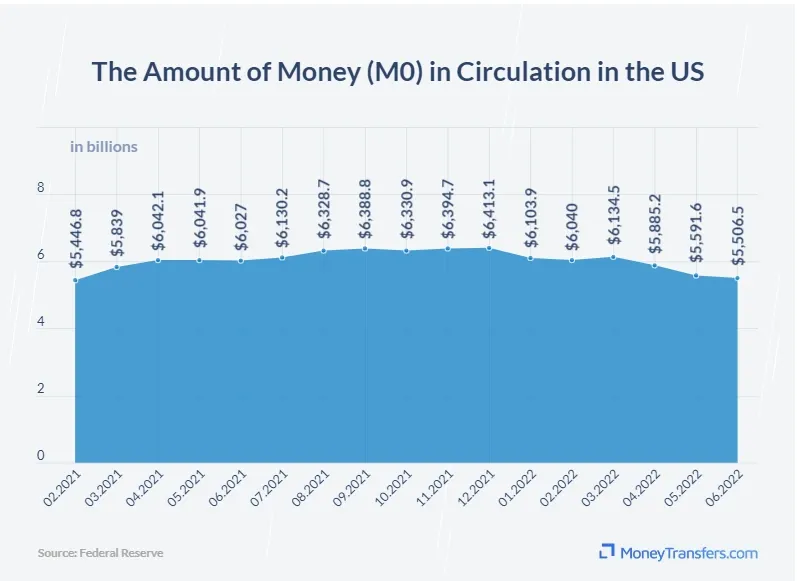
To better understand M2, it should look at the money supply measurements hierarchy which include all M0, M1, M2. Each of them has a unique meaning and includes a different item; M0 represents all physical currencies in circulation (i.e. coins and paper money).It means all the money that people actively use in their transactions around the world. It estimates about 40 trillion dollars as of 2023 based on the central bank's reports. (But according to the personal finance website GOBankingRates, which they estimated from the Bank for International Settlements in 2021, the total actual paper money and coins in the world was 8 trillion dollars worth.)
Building on that, M1 includes M0 and adds all the money held in bank accounts that can be quickly accessed for spending, such as checking accounts. This measure reflects money that is readily available for immediate use. This one is estimated to be about 50 - 60 trillion dollars.
Finally, M2 includes all additional tools like time deposits and other liquid assets plus the M1. Time deposits, like CDs, are funds that are kept in the bank for a set period but can be accessed with some limitations. So, M2 includes all types of money which can be turned into cash very quickly and these monies are important for economic analysis. Understanding M2 potential impact on financial growth and stability plus clarify how money moves in the economy; is estimated at 300 trillion dollars. The financial shares and contracts such as options and futures, is alone valued at 250 trillion dollars. Of course, a large portion of these assets are used in the real estate market which is estimated to be about 300 trillion dollars. And the last is crypto market which includes a very small portion of about 1 - 2 trillion dollars.
Summary
The flow of money and the amount of money in the world are estimates, and as a result, they contain some errors. This is due to the fact that the quantity of money in the world is in a state of constant fluctuation, regardless of its form (e.g., bills (paper money), coins, cryptocurrencies). Consequently, it is impossible to accurately measure and so, certain sources estimate that the total amount of money in circulation worldwide is between 800 and 1000 trillion dollars, which encompasses all forms of money, including banknotes, coins, bank deposits, equities, bonds, and cryptocurrencies plus This includes all financial markets, real estate, and other economic assets It is important to acknowledge that this is merely an estimation, and the actual cost may vary accordingly. Furthermore, it is widely acknowledged that wealth distribution globally is inequitable, with a significant proportion concentrated within a limited number of individuals and corporations.
