


what is NFP in trading
In the lively city of Econoville, where market stalls buzzed and factories hummed, the citizens didn’t rely on crystal balls or lucky charms to understand their economy. Instead, they turned to a wise figure: Dr. Mishov, a seasoned economist who used data and insight to reveal the town’s financial pulse. From job numbers to business sentiment, his monthly updates helped everyone—from traders to tailors—navigate the ever-changing tides of commerce. Through stories and signals like the Non-Farm Payrolls (NFP) and the Purchasing Managers’ Index (PMI), Dr. Mishov offered more than just statistics—he provided a map for the journey ahead.
But as the citizens would come to learn, the impact of each economic report could change depending on the world around them. A job report in times of growth might carry different weight than the same numbers during uncertainty. And so, our tale unfolds—of how Econoville learned to read the signs of the times and adjust course when needed.
The importance of NFP
What is NFP in forex? This report is like a magical mirror that reflects the health of Econoville's job market. It showed how many new jobs were created in the city, excluding those in farming, government, private households, and non-profit organizations. This was because these sectors were often influenced by seasonal factors and didn't provide a clear picture of the overall job market.
The Gathering of Data
Dr. Mishov had a team of diligent data collectors who went around Econoville, visiting businesses, factories, and offices. They gathered information on how many people were hired or let go in the past month. This data was then compiled into the NFP report.
The Big Reveal
On the first Friday of every month, the citizens gathered in the town square to hear Dr. Mishov's announcement. The NFP report would reveal:
-
Job Gains or Losses: The number of new jobs created or lost.
-
Unemployment Rate: The percentage of people actively looking for work but unable to find jobs.
-
Wage Growth: Changes in average hourly earnings, indicating whether wages were rising or falling.
The Impact
The NFP report had a significant impact on Econoville. If the report showed strong job growth, it meant businesses were thriving, and more people had money to spend. This often led to increased consumer confidence and economic growth. On the other hand, if the report showed job losses, it could signal economic trouble, leading to cautious spending and potential downturns. you can read about all of these through more articles.
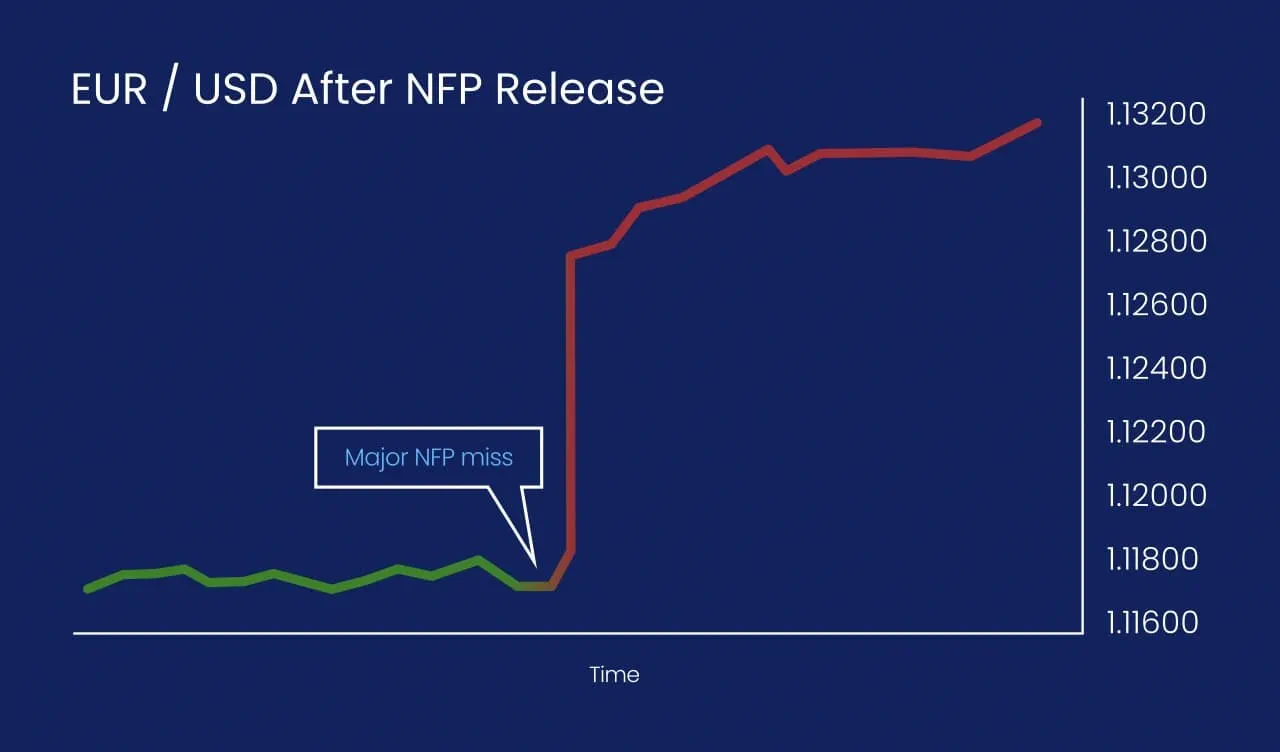
The market reaction
Investors in Econoville's stock market paid close attention to the NFP report. Positive job numbers often led to a rise in stock prices, as it indicated a healthy economy. Conversely, negative job numbers could cause stock prices to fall, as investors worry about economic stability.
The Lessons Learned
Over time, the citizens of Econoville learned to appreciate the insights provided by the NFP report. They understood that while it wasn't a perfect measure, it offered valuable clues about the direction of their economy. Dr. Mishov's monthly announcements became a cornerstone of their economic planning and decision-making.
And that's how the Non-Farm Payrolls (NFP) report played a crucial role in guiding the citizens of Econoville.
Look, I need to mention this several times: each economic data release might have a varying influence on markets depending on the current state of the global economy. We will circle back on it further ahead.
-
Non-Farm Payroll (NFP): As explained earlier, the non-farm payroll report estimates the net number of jobs gained in the US in the previous month, excluding those in farms, private households, and non-profit organizations. It is usually released on the first Friday of the month, in an ‘Employment Situation’ report that also includes the US unemployment rate, average hourly earnings, and participation rate. And based on the current situation of an economy each one of these can have a higher or lower impact.
NFP in forex is probably one of the most significant economic indicators. Traders from across the financial markets will attempt to predict the headline NFP figure each month, as well as its potential market impact. Releases monthly, usually on the first Friday after the month ends.
Why is NFP important?
The Federal Reserve has the mandate to maintain ‘maximum employment’ in the US, as well as stable prices. So they’ll pay close attention to NFP when setting interest rate policy. If employment looks strong then they may consider raising interest rates. If it is weak, lower rates could be on the cards.
As the US is the world’s largest economy, any actions by the Fed tend to have a significant impact on global financial markets.
-
Central bank meetings :
As we’ve seen, most traders follow economic figures so they can anticipate what a central bank might do next. So, it only makes sense that we pay attention to what happens when they actually meet and make decisions.
Each central bank will have its own regular meetings. For example, the Federal Open Market Committee (FOMC) – which is in charge of setting monetary policy for the Federal Reserve – usually meets eight times each year.
Why are central bank meetings important?
Traders will watch for any announcements from each meeting, such as rate hikes or cuts, forward guidance on future policy, or any other new monetary measures (such as quantitative easing).
Often, the minutes from a meeting will be released shortly afterward. This can provide crucial insight into whether key central bank personnel are hawkish or dovish. But these minutes have so much less impact on markets compared to FOMC meetings.
-
Consumer and business sentiment reports:
Multiple organizations are constantly surveying consumers and business leaders to create sentiment reports. While the number of reports they produce is staggering, they all play their part in shaping the markets’ expectations for the future.
Why are sentiment reports important?
An economy needs businesses and consumers to spend in order to thrive. If businesses and consumers are feeling apprehensive about the economy, then spending tends to be lower – which may impact growth, employment, and inflation down the line.
As such, these reports tend to be leading indicators. While employment and inflation figures are reported on past quarters, sentiment reports can give you an insight into what’s going to happen next.
-
Purchasing Managers Index (PMI):
Purchasing managers indices measure the prevailing direction of economic trends in a given industry, according to the view of its purchasing managers. They are used as an indicator of the overall health of a sector.
Like price indices, there are typically multiple different PMIs released for any given economy.
-
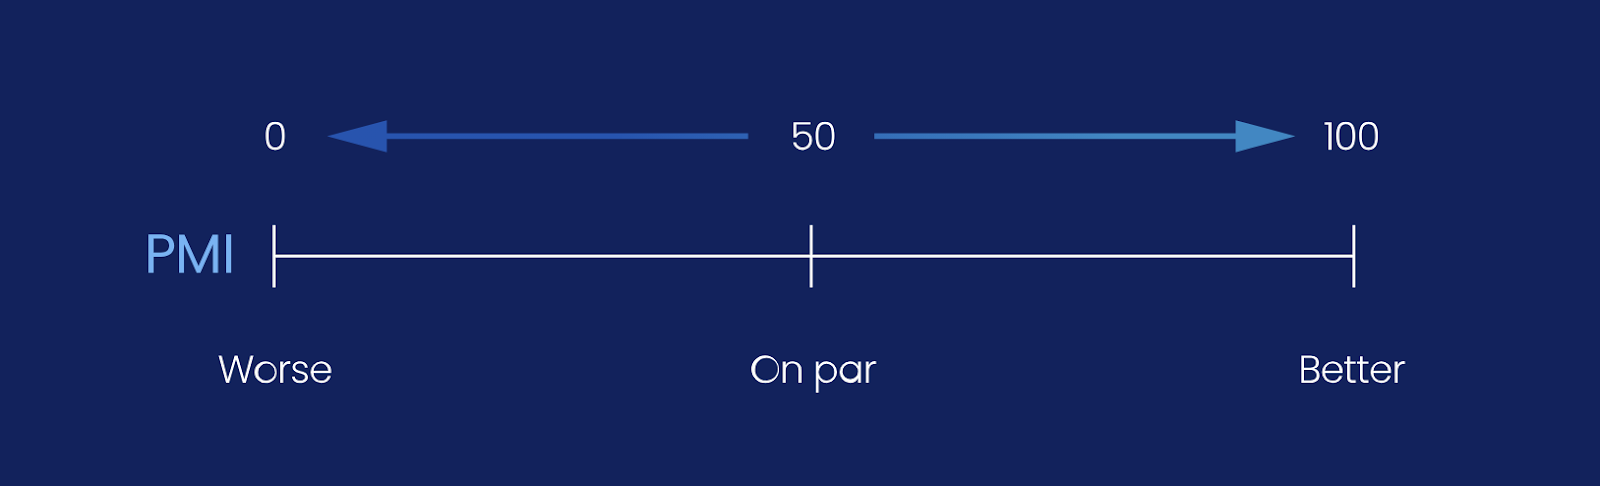
A PMI figure above 50 indicates that managers believe that their business is performing better in the current month than the previous one.
-
If it is below 50, then managers have seen less activity this month than the last
-
If it is at 50, then the current month is on par with the previous one.
In releases, there are three types of PMI, such as:
-
Manufacturing PMI
-
Services PMI
-
Composite PMI
And 4 institutes measure and release PMI data :
-
ISM (Institute of Supply Management)
-
S&P
-
Flash
-
Chicago
Why is PMI important?
PMIs are used to get a quick on-the-ground assessment of how a sector is performing from the people working within it. If a key sector in a country is stalling, then the economy may soon follow. On the other hand, if it is thriving, growth could be on the horizon.
Let's continue the story of Econoville to explain PMI (Purchasing Managers' Index):
In the heart of Econoville, there was a bustling marketplace where traders, shopkeepers, and manufacturers gathered. Among them was a clever merchant named Dr. Mishov, who had a keen eye for the town's economic trends. He used a special tool called the Purchasing Managers' Index (PMI) to gauge the health of the economy.
One day, Dr. Mishov noticed that the marketplace was unusually busy. He decided to survey the purchasing managers of various businesses to understand the situation better. He asked them about new orders, inventory levels, production, supplier deliveries, and employment. These questions helped him gather valuable insights into the economic activities of the town.
Dr. Mishov compiled the responses and calculated the PMI, which ranged from 0 to 100. A PMI above 50 indicated that the economy was expanding, while a PMI below 50 suggested contraction. On this particular day, the PMI was 55, signaling that Econoville's economy was growing.
With this information, Dr. Mishov could make informed decisions about his business. He knew that a high PMI meant increased demand for goods and services, so he decided to stock up on popular items and hire more workers to meet the rising demand. Other merchants in the marketplace also used the PMI to plan their strategies, ensuring they were well-prepared for the economic trends.
Thanks to the PMI, the people of Econoville had a reliable indicator of their economic health. It helped them understand whether the economy was growing or shrinking, allowing them to make better business decisions and contribute to the town's prosperity.
