


Market Analysis 30 Jul 2025

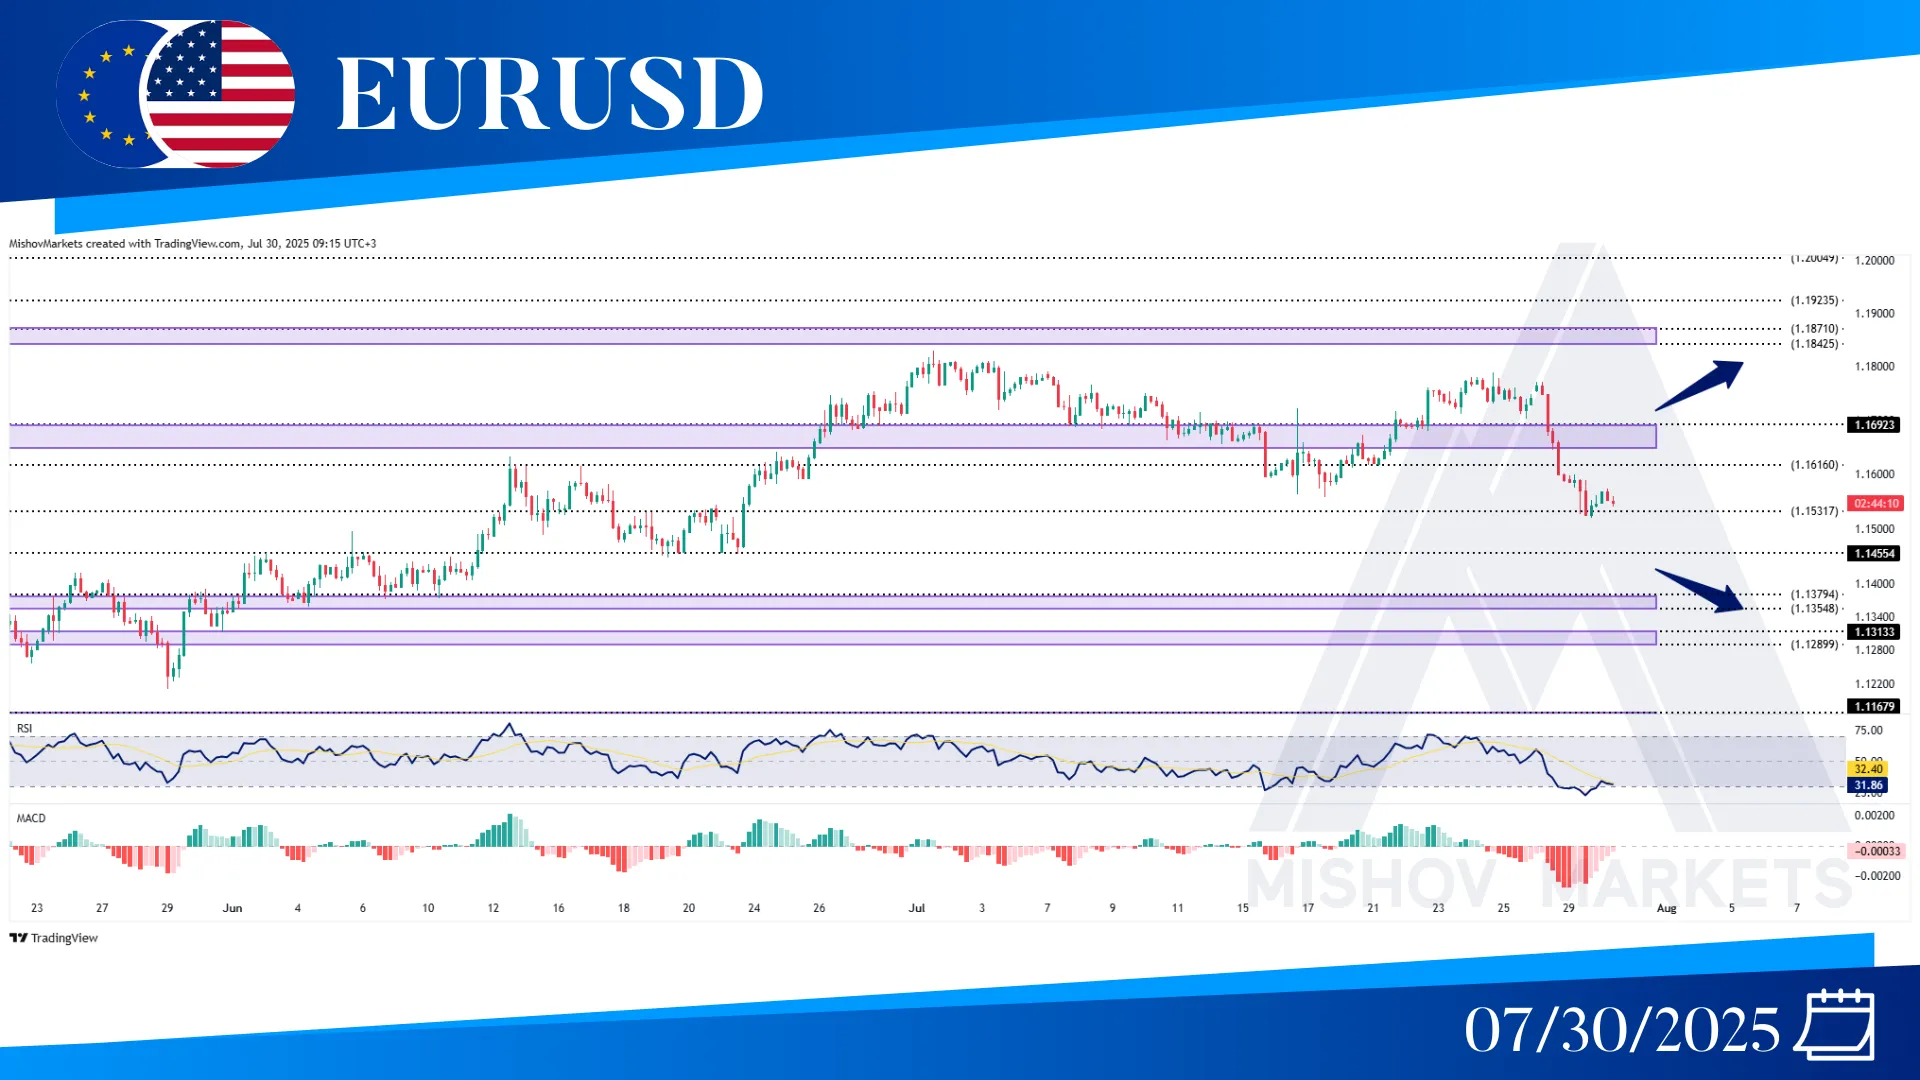
In EURUSD, as precisely mentioned in Monday’s analysis, the price broke below 1.16920-1.16530 and started to move toward our target at 1.15310. Now if it provides a close below 1.15310, it could then decrease further toward the 1.14550 and 1.13540-1.13750 zones. But if this zone supports the price, it could reach our bullish targets at 1.16530, 1.17455, 1.18420–1.18710, 1.19230 and 1.20040. In the meantime, the 1.16920-1.16530 zone might act as resistance and push the price toward our targets at 1.15310, 1.14550, and the 1.13540-1.13750 zone.
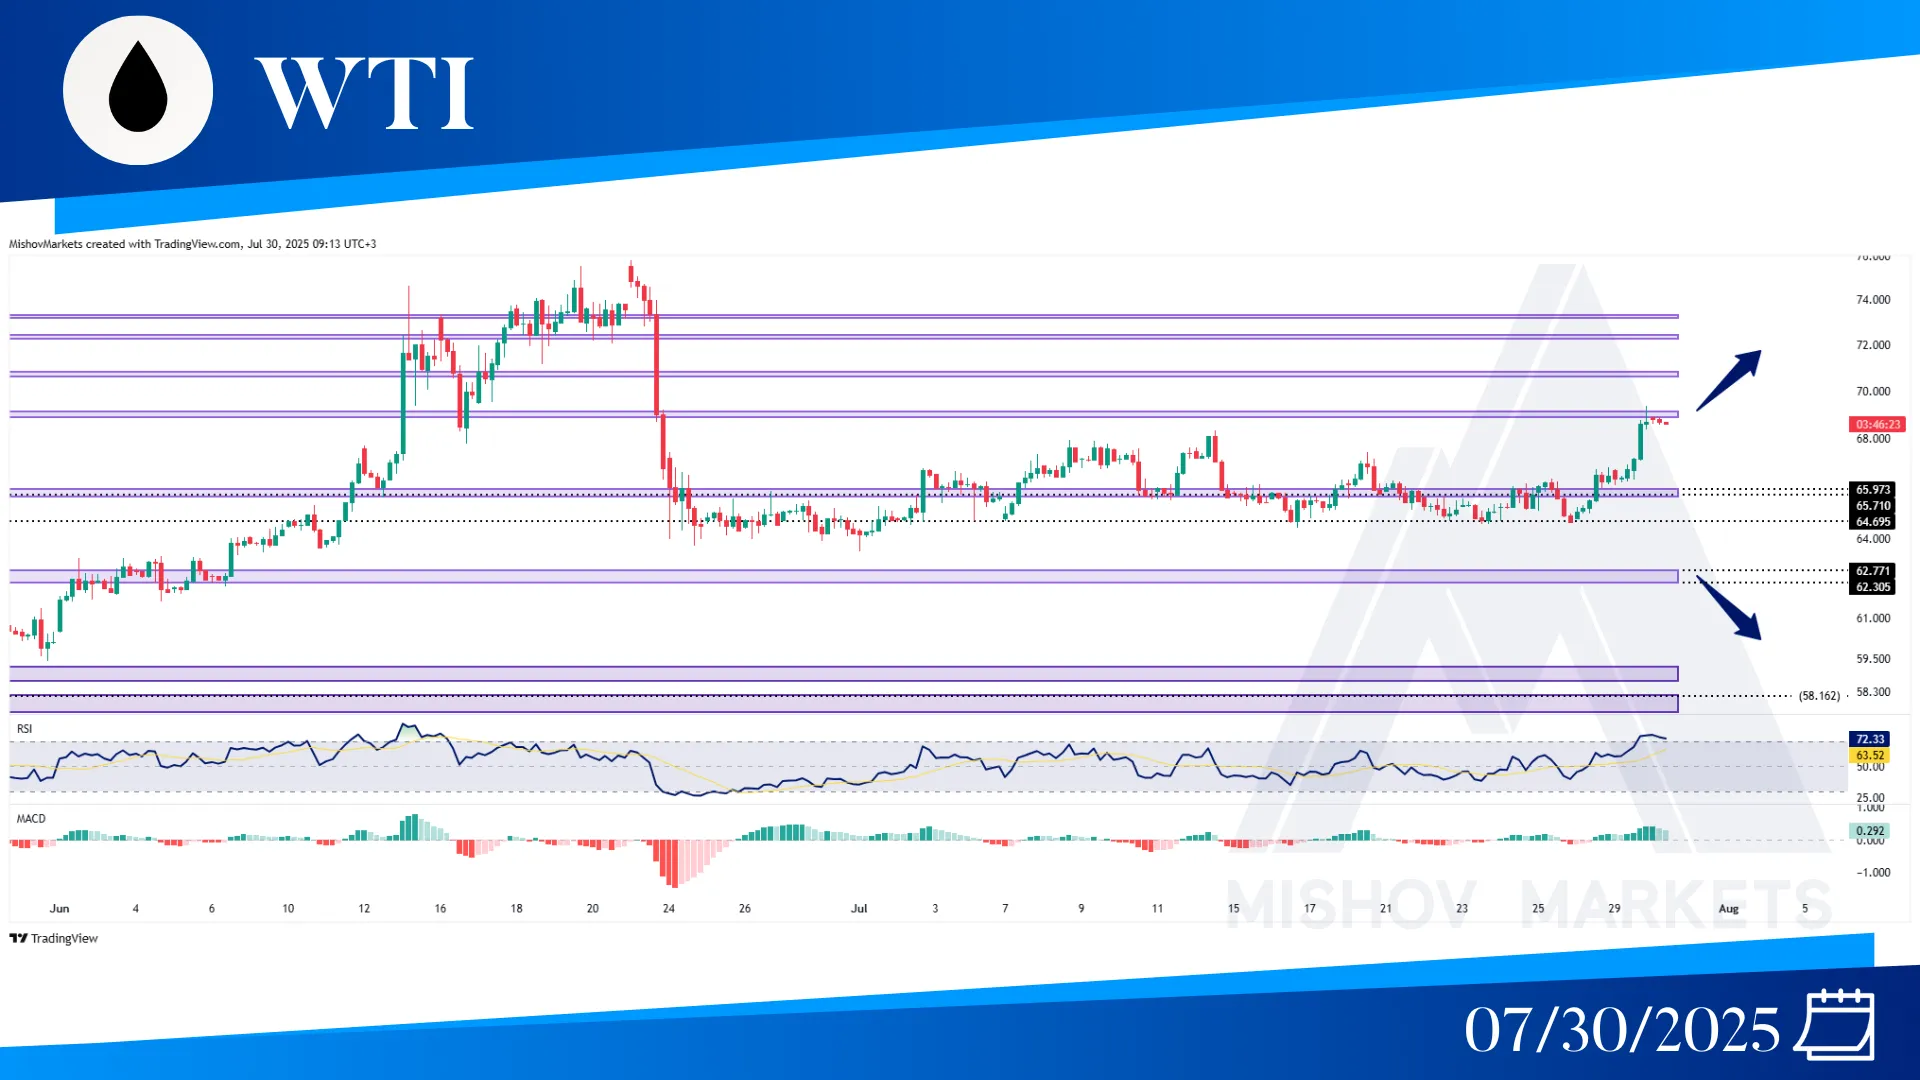
In WTI, as precisely mentioned in Monday's analysis, the price received support from the 64.690 and after breaking above 65.970, it started to increase toward our target at 68.360-69.100. Now if the price continues to increase and provide a close above 69.500, then it could continue to move toward 70.690 and 72.200. But it could face resistance and start to move toward 65.970-65.710 to receive support from it, and if it fails to support and then also the 64.690 or 63.900 zones fail to support the price and it provides a close below 63.400, it could decrease further toward 62.770-62.300 and 59.200-58.840.
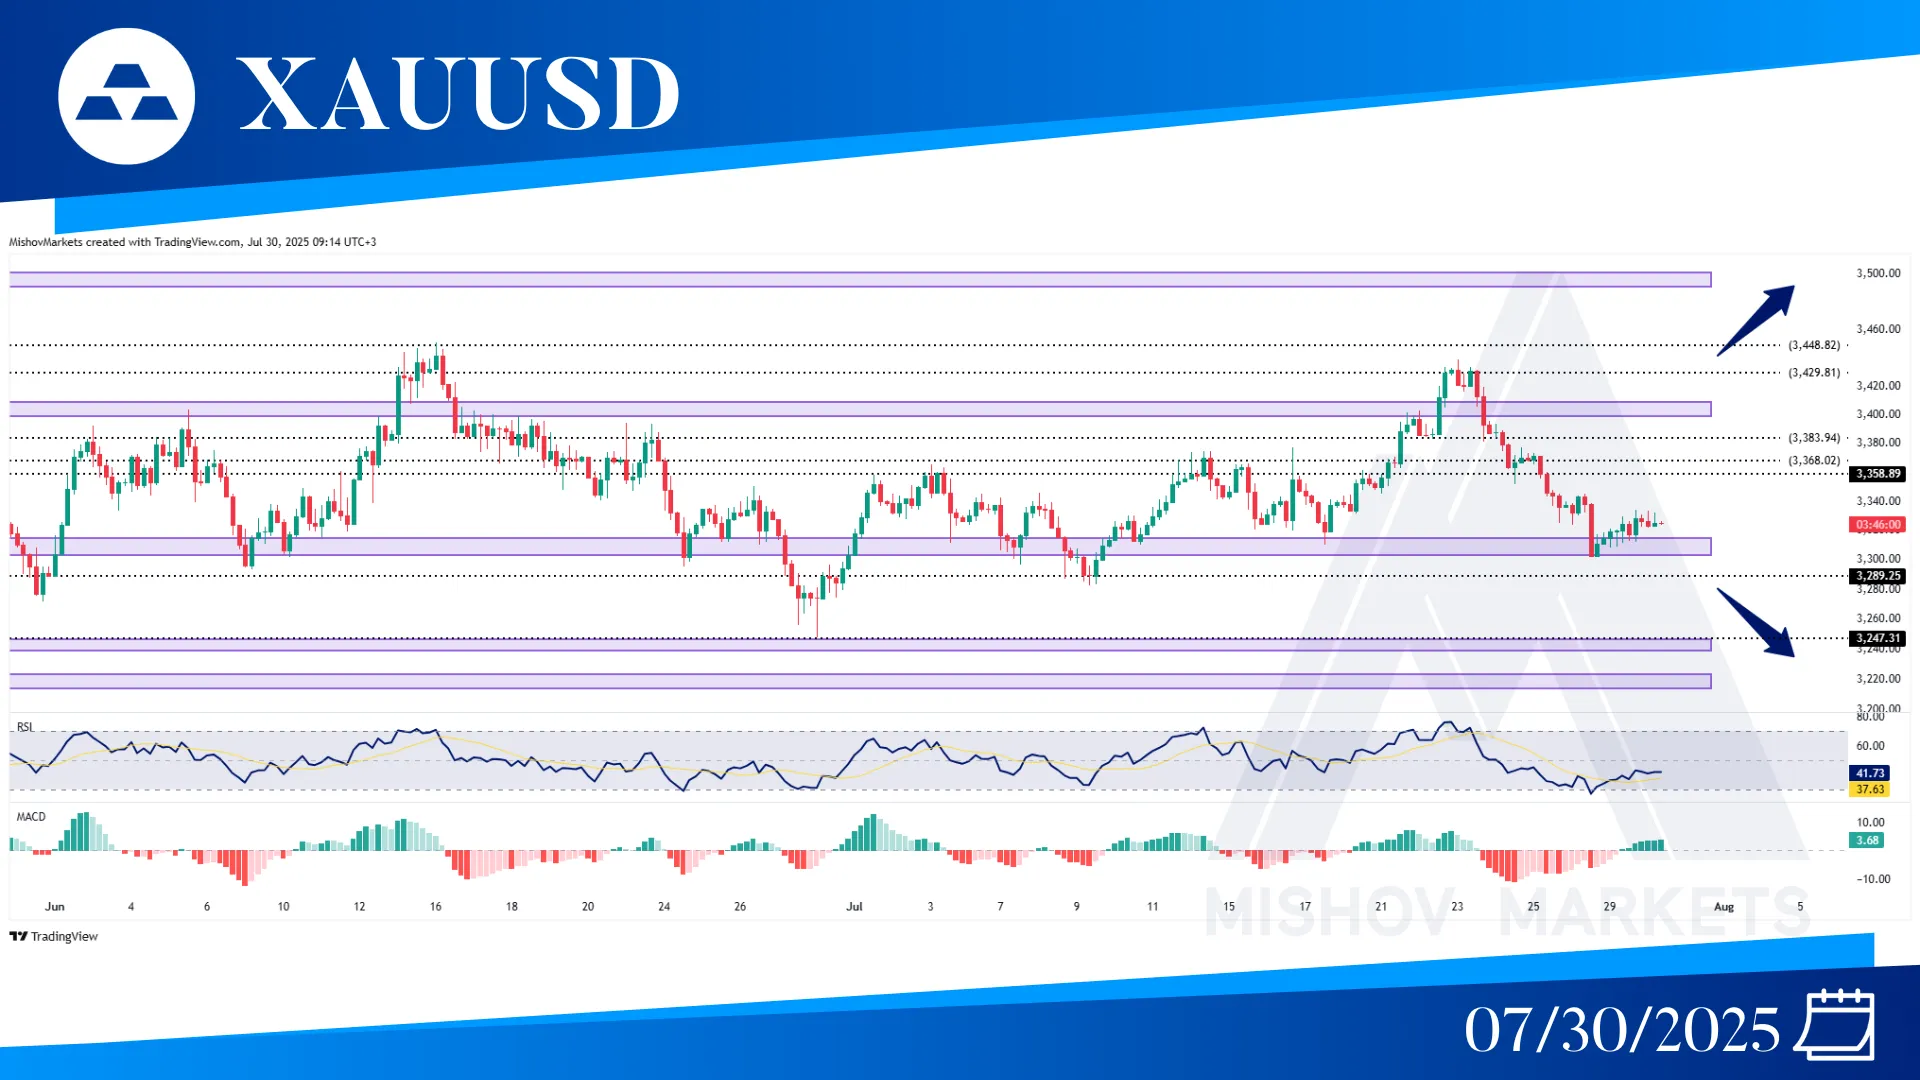
In XAUUSD, as precisely mentioned in Monday’s analysis, the price continued to decrease and reached our target at 3315-3305. Now the price is trying to receive support from this zone and move toward 3358 for resistance, but if it fails to support the price and it continues to decrease, then it could reach our targets at the 3289, 3247, 3224-3213, and 3182-3173 zones. On the other hand, if it breaks above 3358 and provides a close above 3370, then it could continue to increase toward 3383, 3398-3407, 3429, 3448, 3490-3500, and 3580.
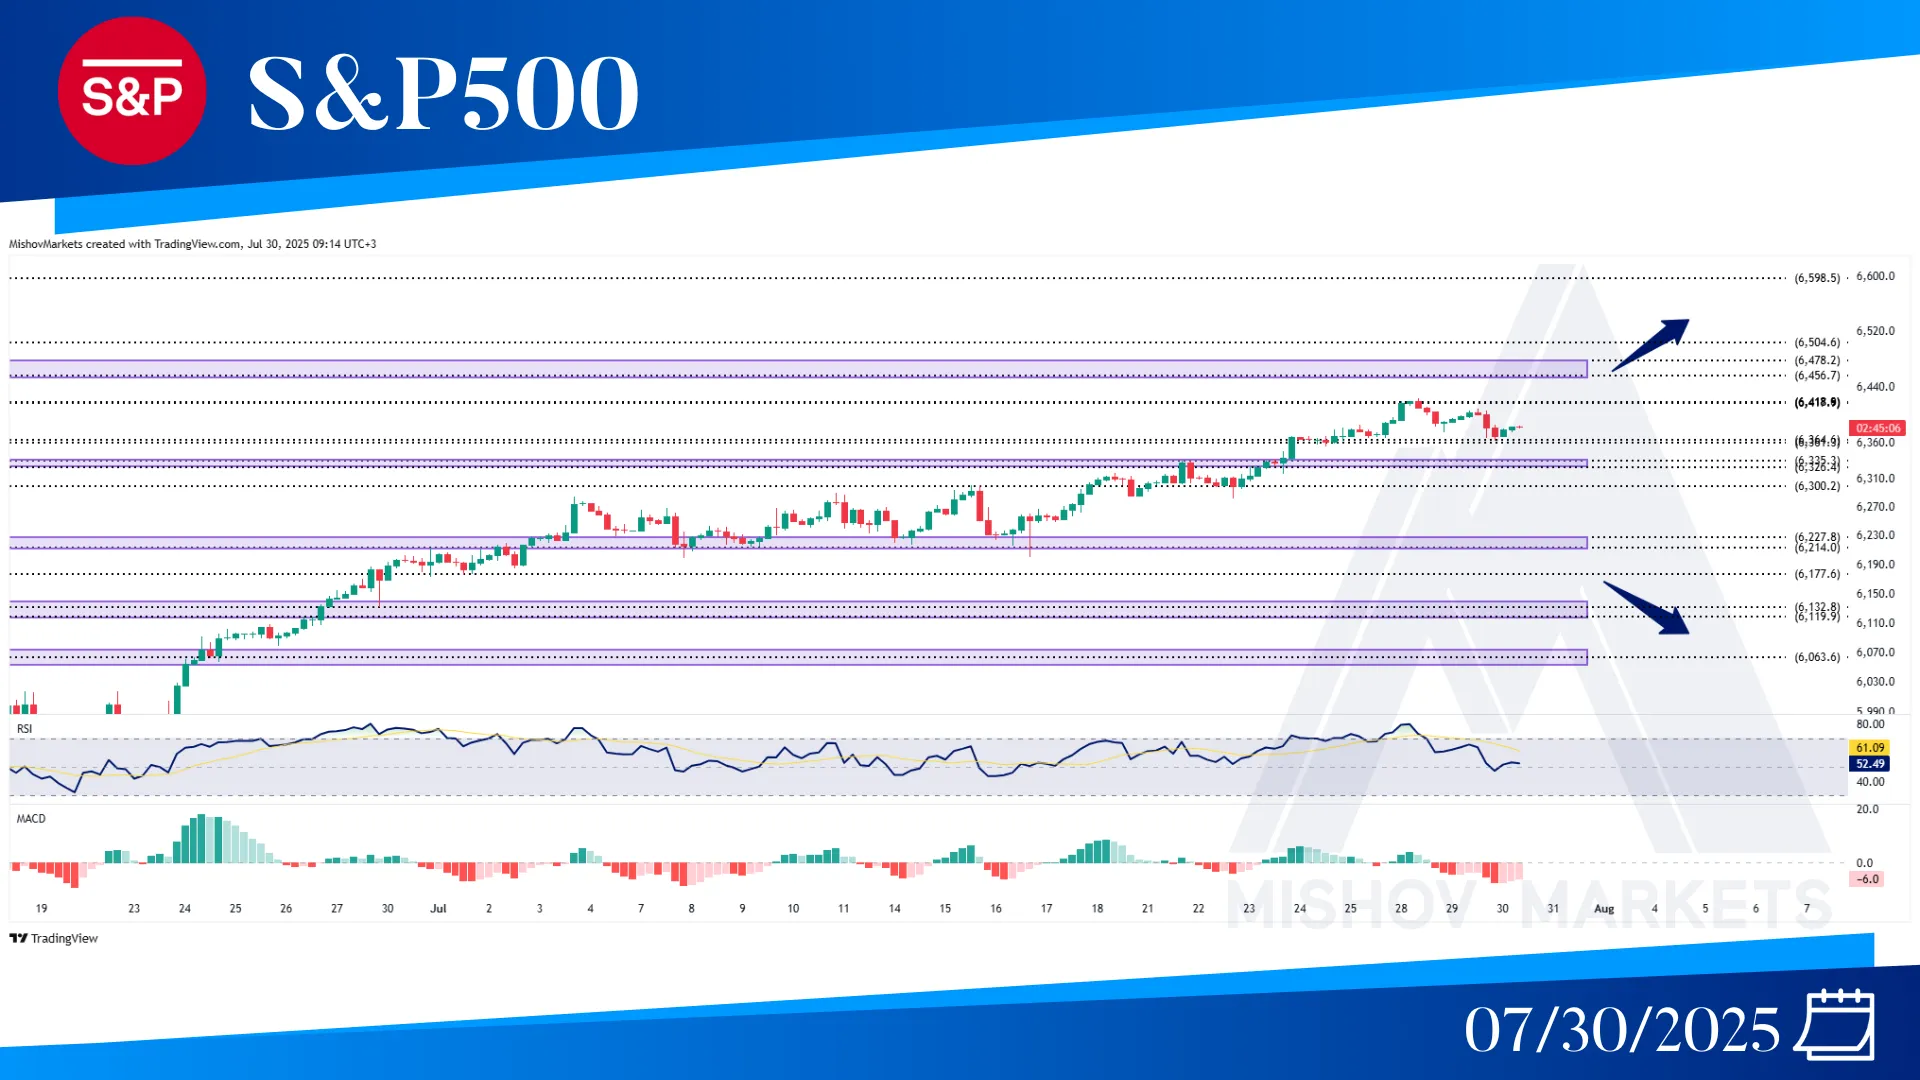
In the S&P 500, as precisely mentioned in Monday’s analysis, the price encountered resistance at 6418 and has returned to test the 6364-6361 zone for support. Now if it supports the price and it breaks above 6425, then it could continue to move toward 6456-6478 and 6504. But if the 6364-6361 or 6335-6326 zones fail to support the price, then it could decrease further toward our targets at 6227-6214, 6177, and 6132-6119.
