


Market Analysis 29 Dec 2025

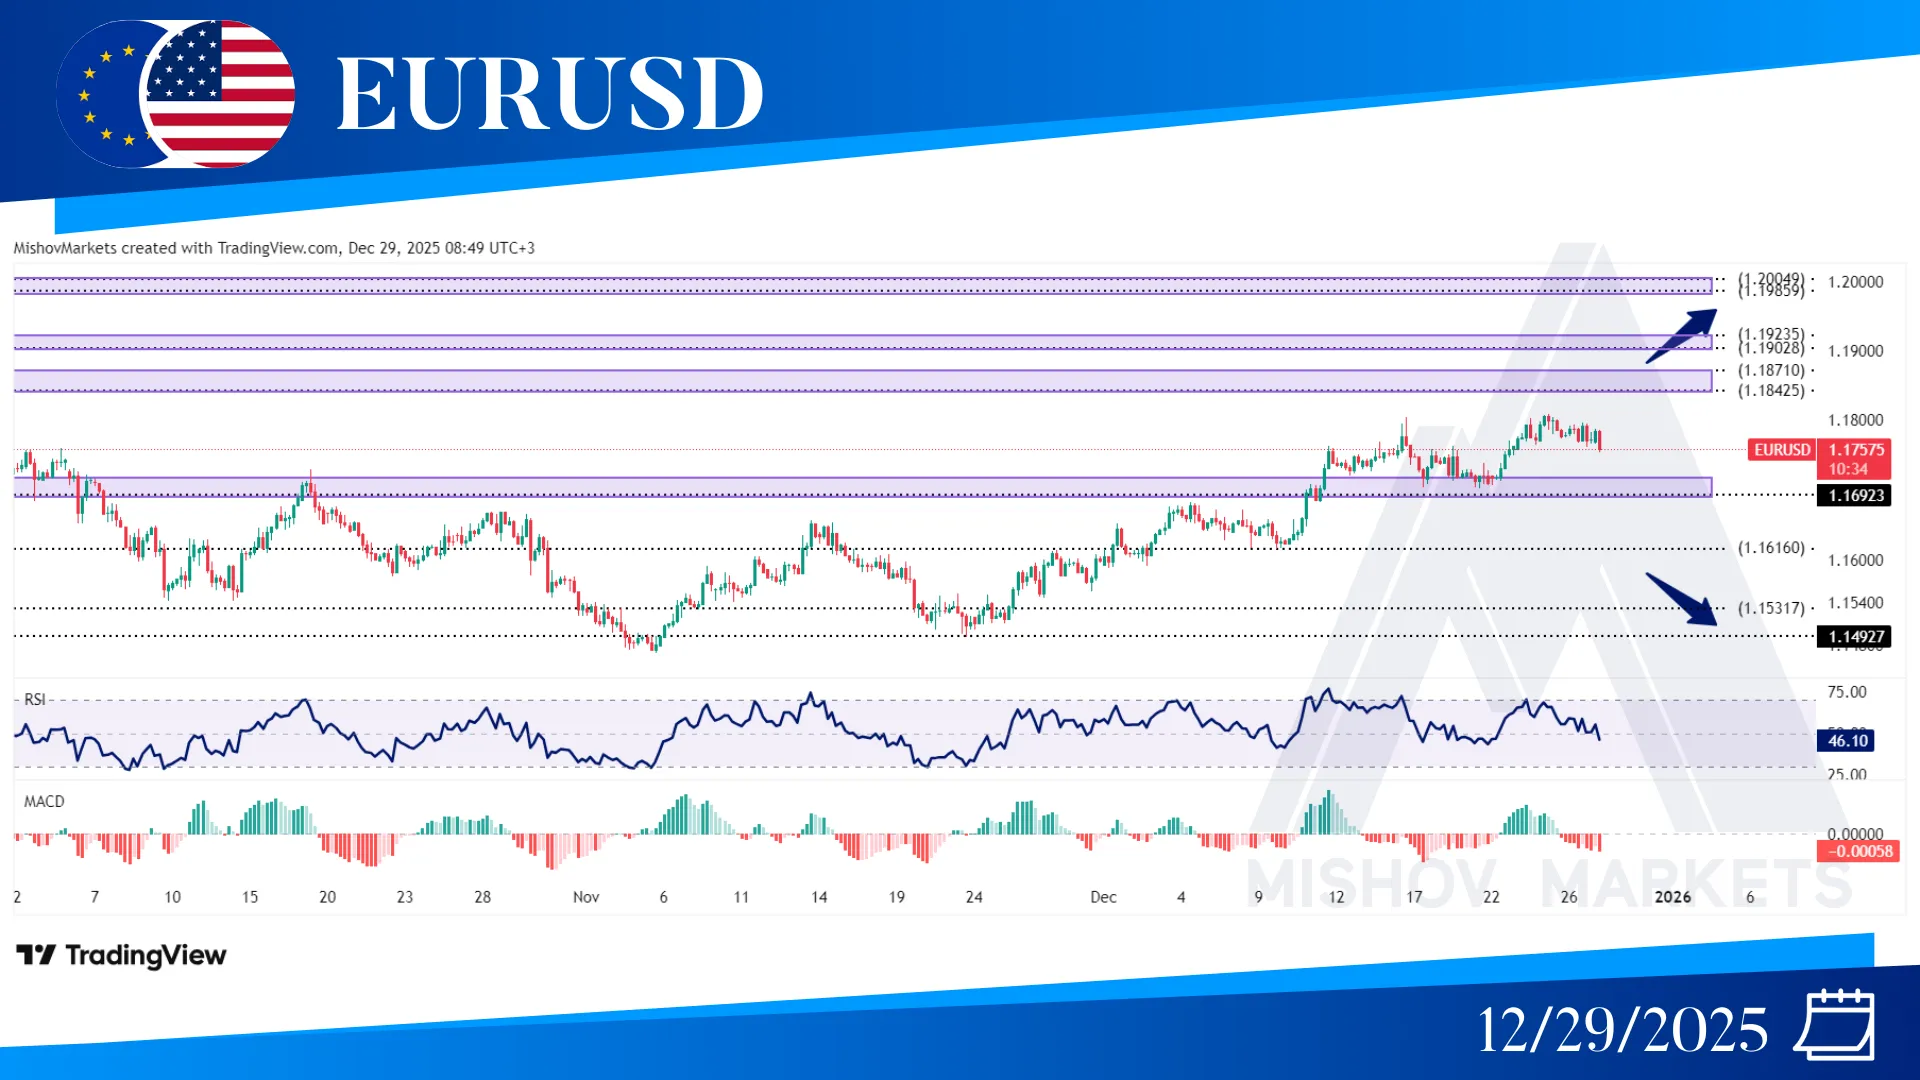
In EURUSD, as precisely mentioned in Wednesday's analysis, the price was unable to provide a close above 1.18080 and has started to retrace some of its bullish momentum. Now if the price continues to increase with a close above 1.18100, it could continue to reach our targets at 1.18420–1.18710, 1.19230, or possibly 1.20040. However, the price might return to test the 1.16920–1.17150 zone once more; if it receives support, it could continue to increase toward the aforementioned targets. But, if it fails to find support at this zone and the 1.16160 level also fails to provide support, the price could decrease further to reach targets at the 1.14950, 1.13540–1.13750, and 1.13150–1.128.
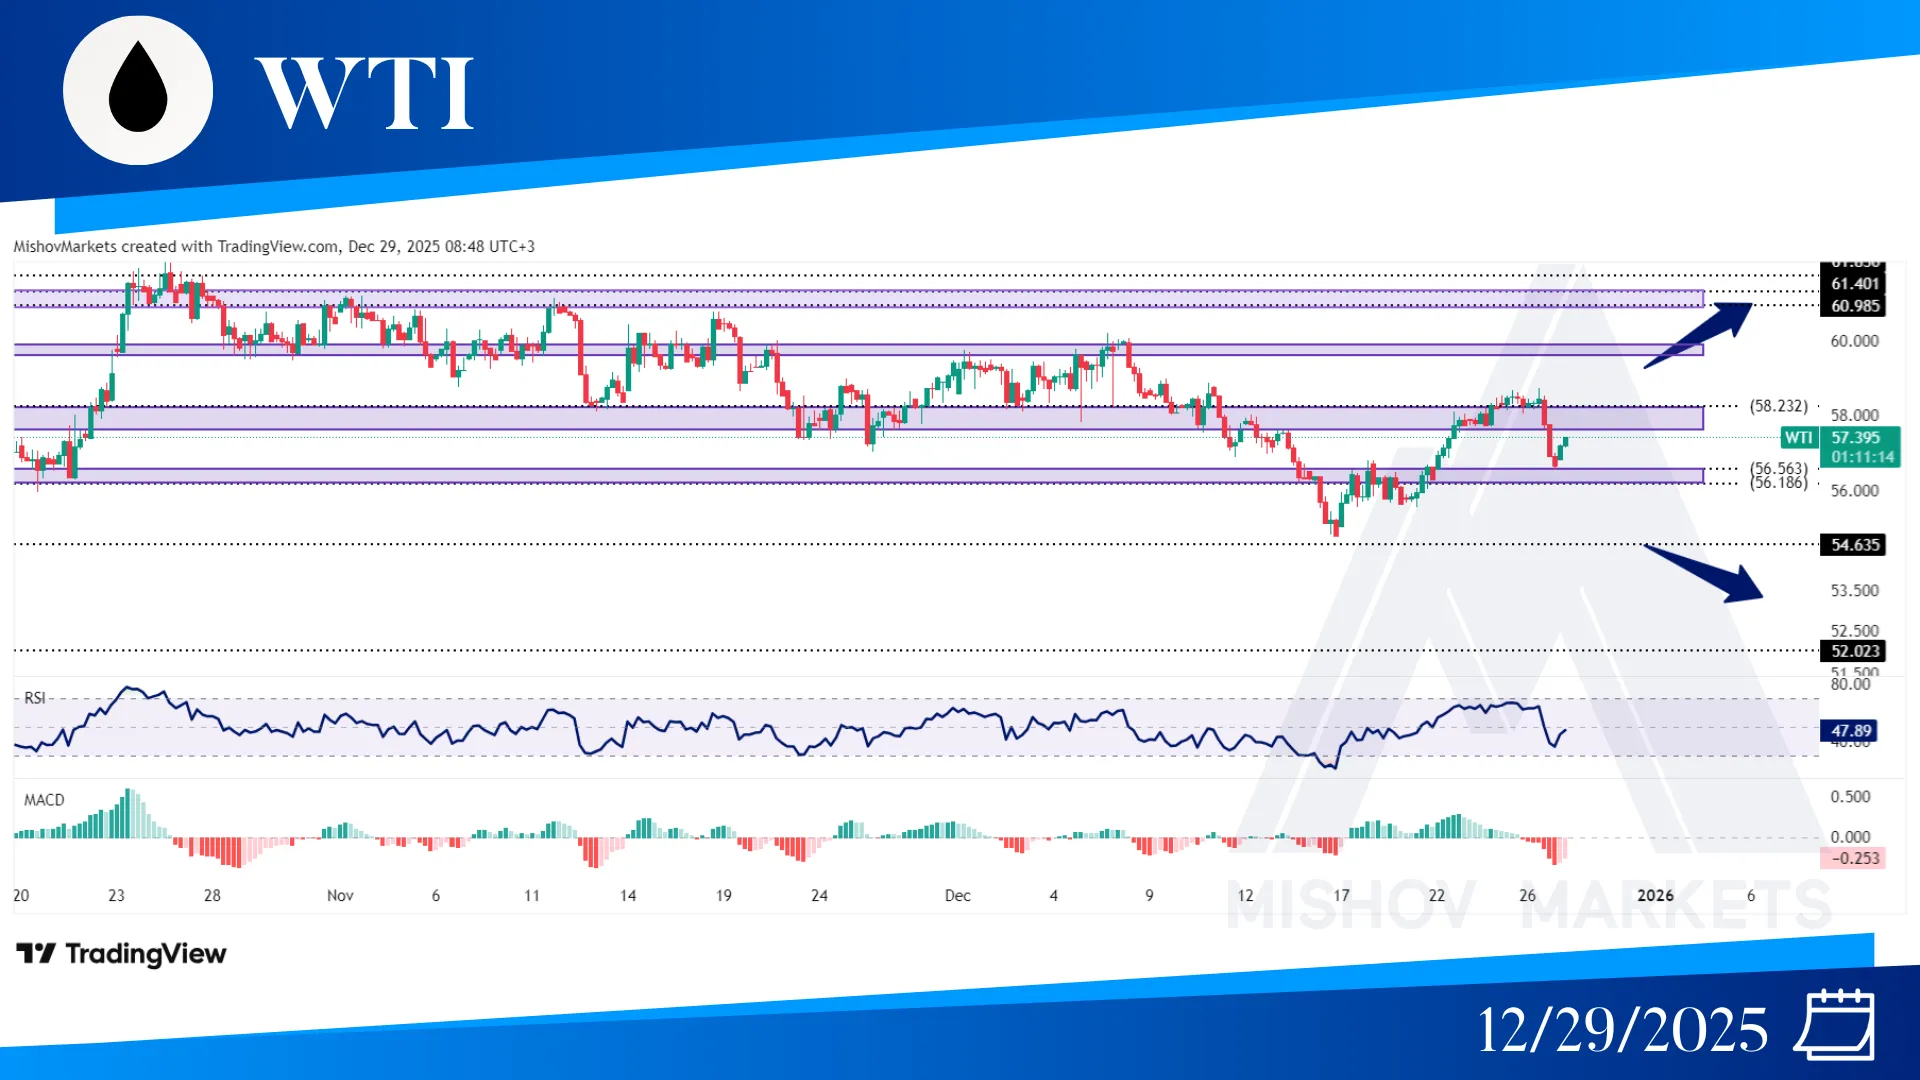
In WTI, as precisely mentioned in Wednesday's analysis, the price was unable to close above 59.000, and the 58.230 zone acted as resistance, pushing the price toward our target at 56.570-56.180. Now if this zone supports the price and it breaks above the 58.200 zone with a close above 59.000, it could reach our targets at 59.610–59.900, 60.980-61.400, and 61.850, and if it provides a close above 62.500, then it might continue to move toward the ranges of 64.690, 65.710, 67.790-67.980, and even 69.100. However, if the price encounters resistance at the 58.150 level, it may begin to move towards the 56.570–56.180 range to seek support; additionally, if it fails to find support there, it could decline further towards the levels of 54.630, 52.020, and 49.880.
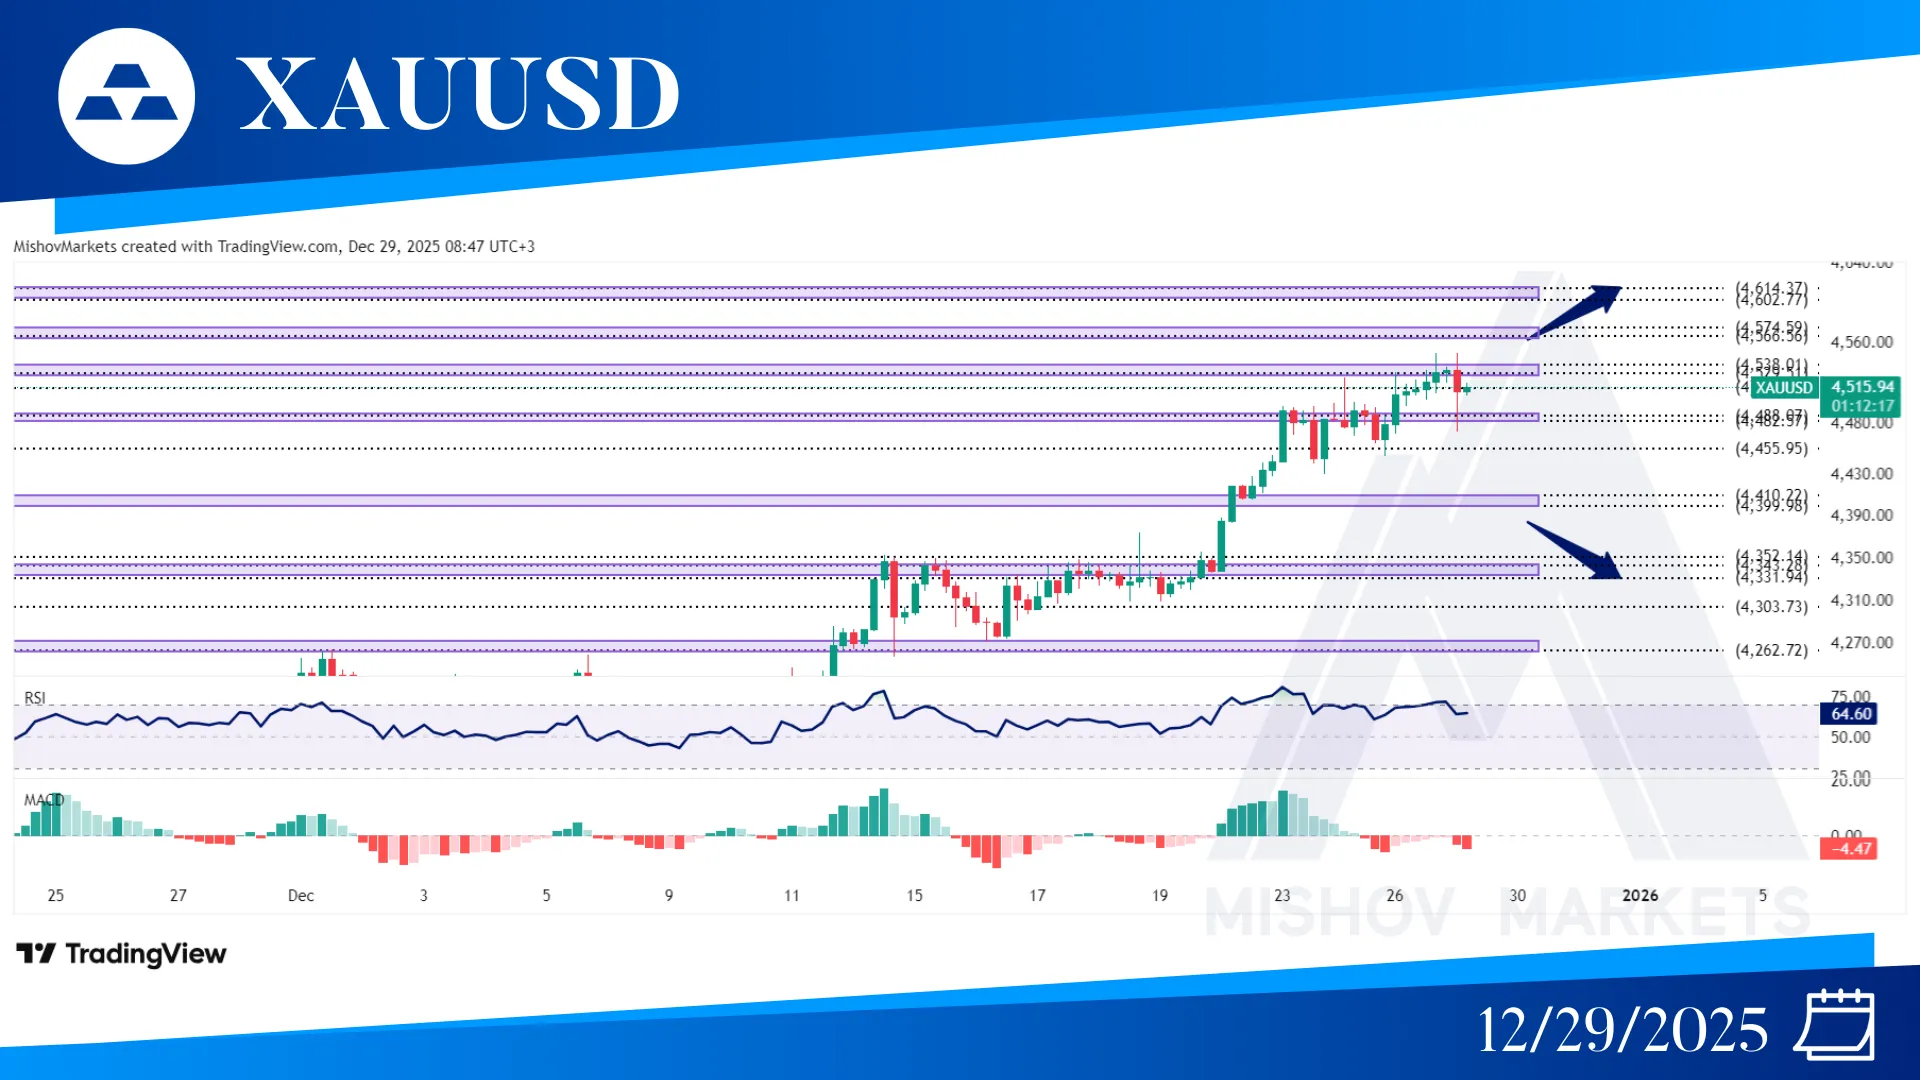
In XAUUSD, as precisely mentioned in Wednesday’s analysis. The price received support from the 4455 zone and continued to increase; however, after reaching our target at 4538, it encountered resistance and began to retrace some of its bullish momentum. Now if the price receives support from 4455 and continues to increase, it could reach our targets at 4515 and 4529-4538, and if it breaks it with a close above the 4551 level, it could continue to increase toward our targets at 4566-4574, 4602-4614, and 4675. But if the 4455 fails to support the price, followed by a break below the 4410-4399 zone, it could decrease toward 4352, 4343-4331, 4303, 4272-4262, 4235, 4205-4192, and 4149-4143 for support.
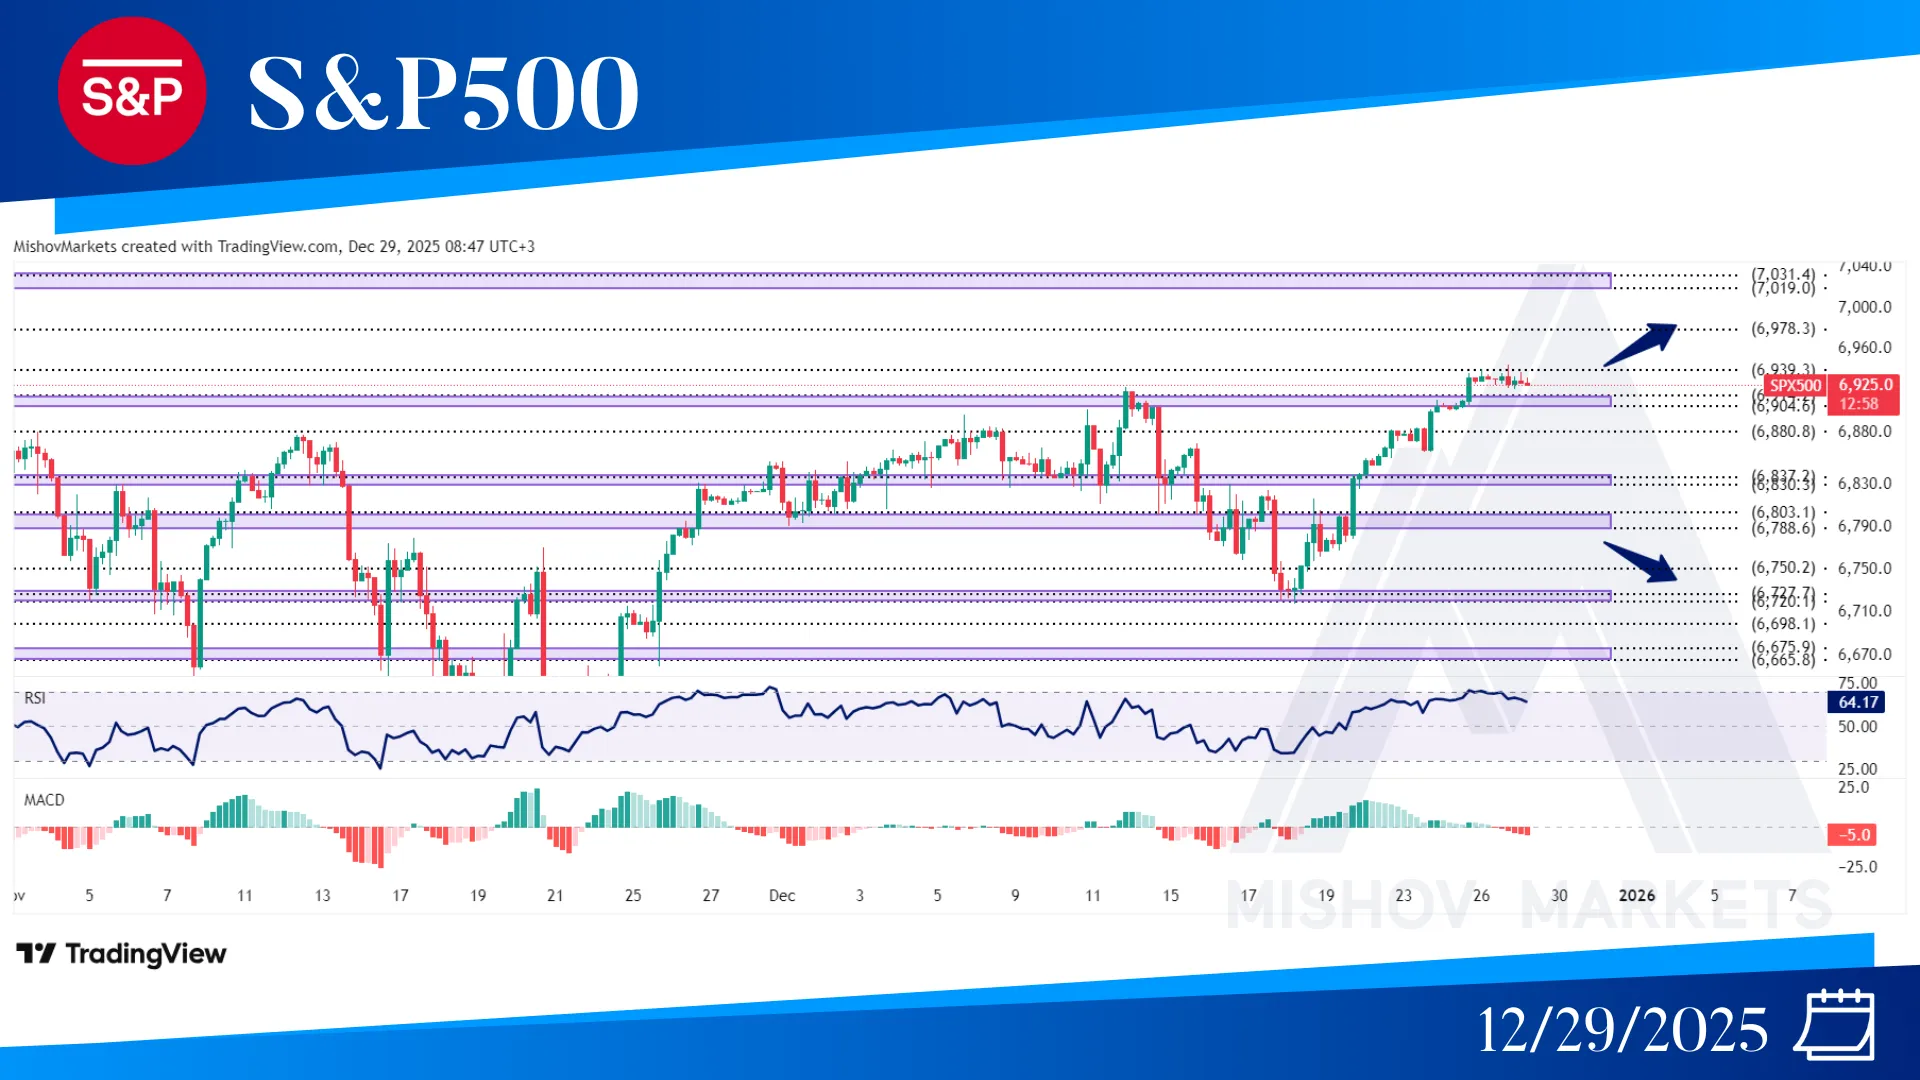
In the S&P 500, as precisely mentioned in Wednesday’s analysis, the price broke above 6904-6914 and, by providing a close above 6930, continued to reach our targets at 6939. Now if the price breaks this zone with a close above the 6946 level, it could reach our targets at the 6978, 7019-7031, and 7118-7141 zones. However, if the 6939 zone acts as resistance, the price could decrease toward the 6914-6904, 6880, 6837-6830, 6803-6788, 6750, 6727-6720, 6698, and 6675-6665 zones to seek support.
