


Market Analysis 26 Nov 2025

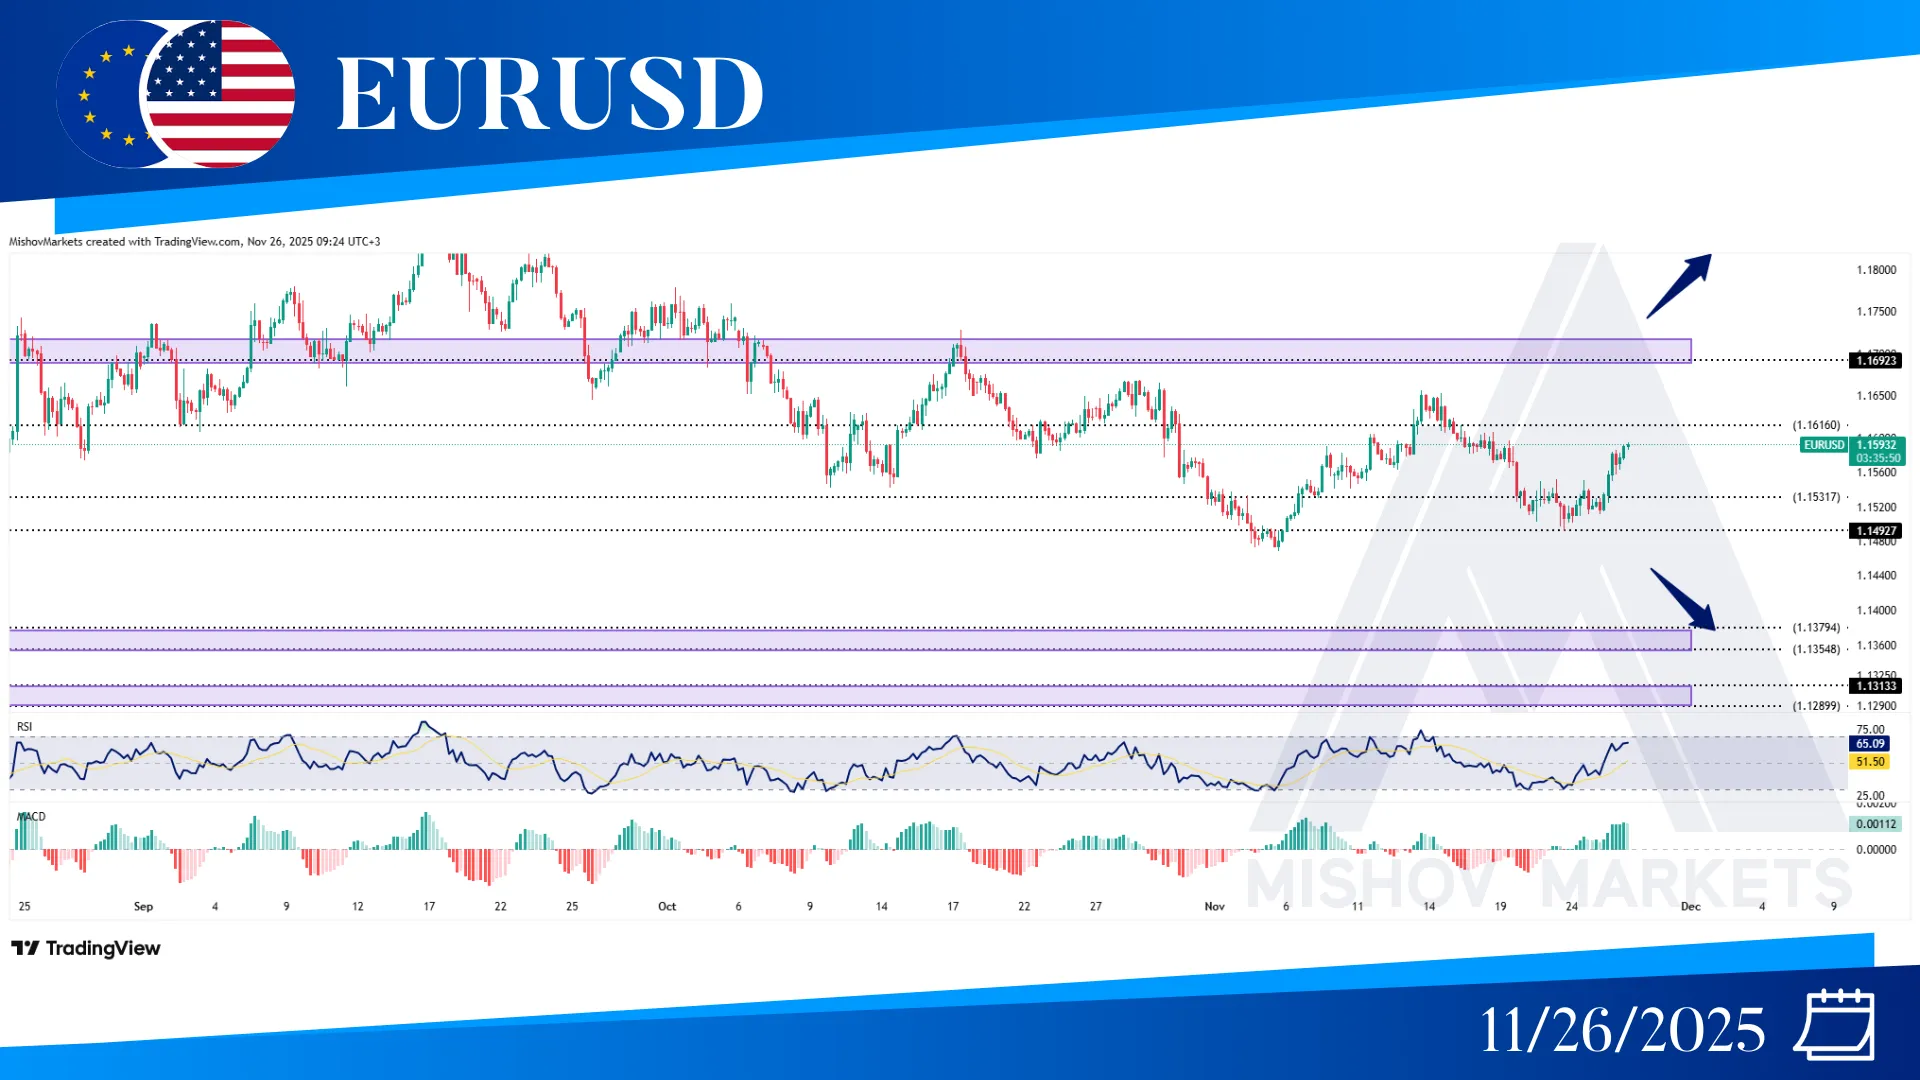
In EURUSD, as precisely mentioned in Monday's analysis, the price received support from the 1.14950 level and has started to increase. Now if the price continues to increase, it could start to reach our targets at 1.16920, 1.17300, 1.18420-1.18710, 1.19230, or possibly 1.20040. However, if the 1.14950 level fails to support the price, it could decrease more to see the targets at the 1.13540-1.13750 and 1.13150-1.12890 zones.
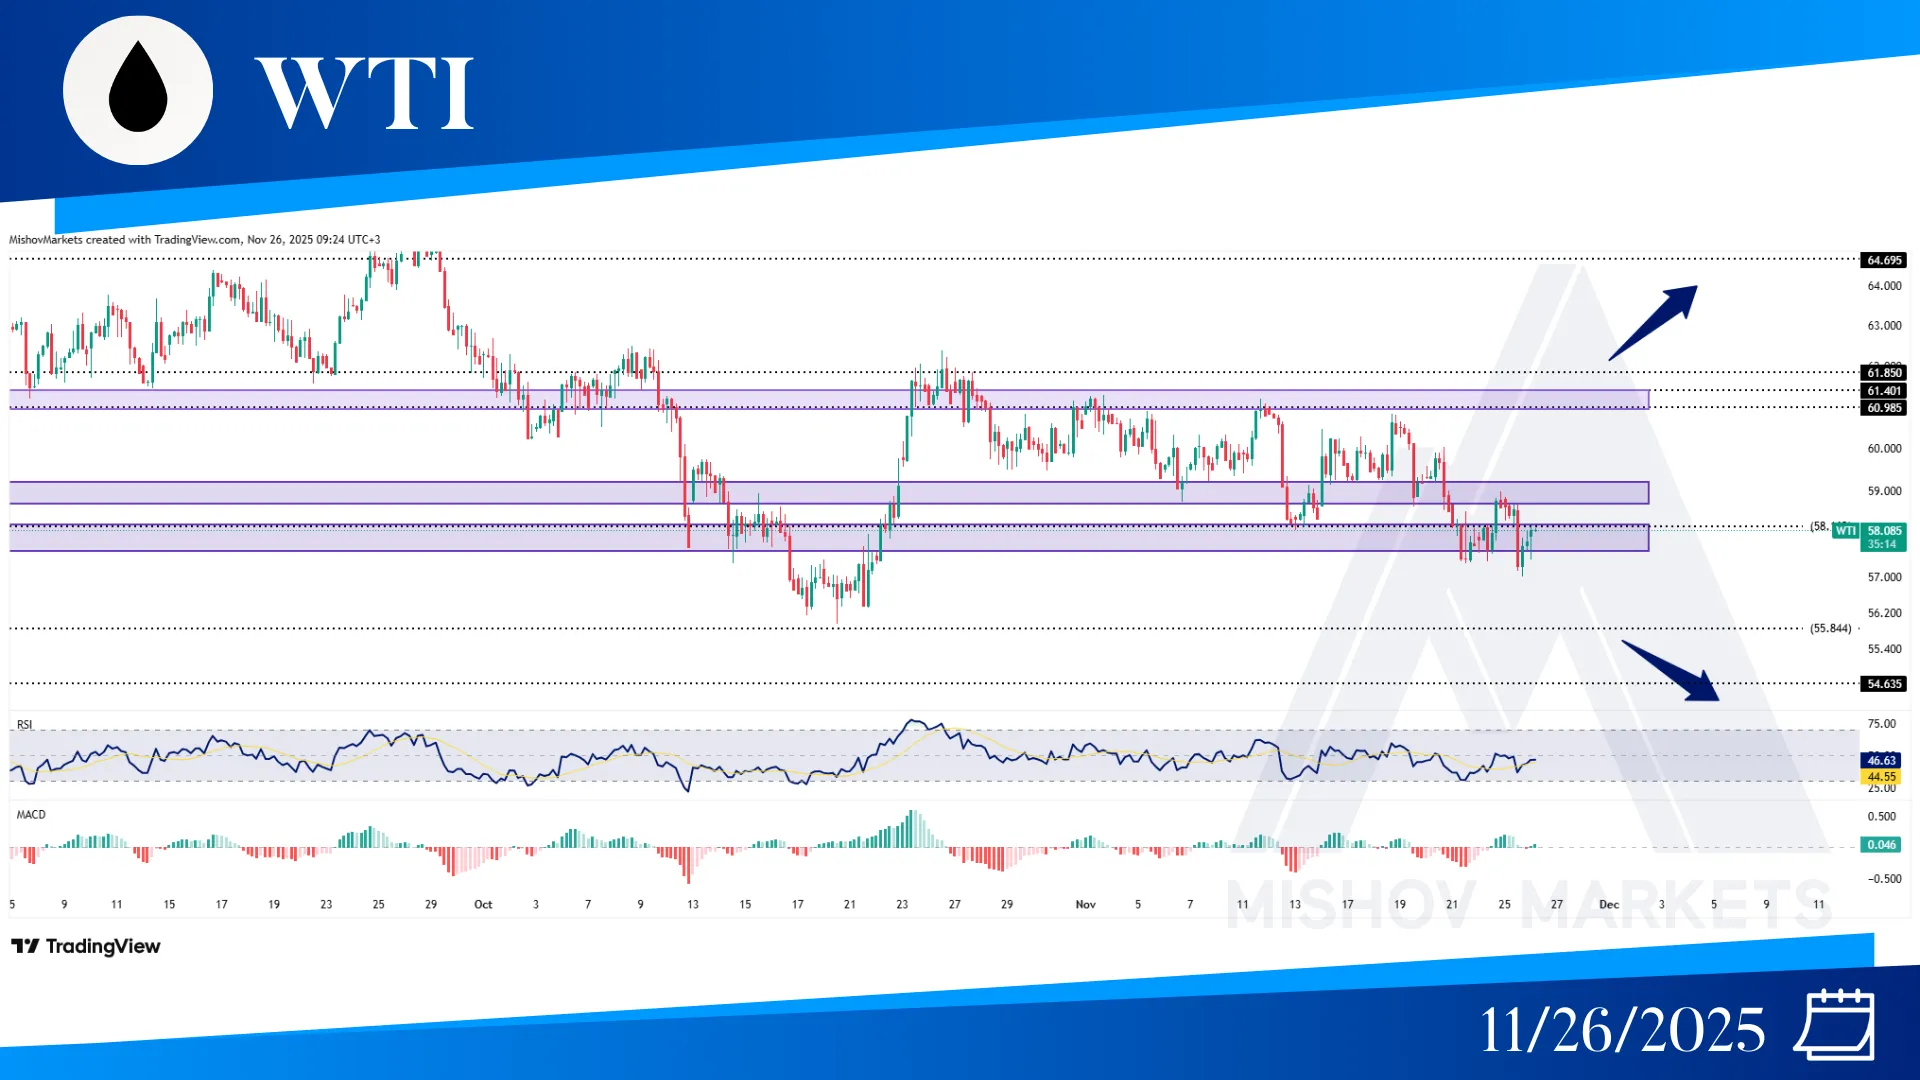
In WTI, as mentioned in Monday's analysis, the price is still trying to receive support from the 58.150-57.600 zone. Now if this zone fails to act as support, and prices provide a close below the 57.000 level, then it could decrease further toward the ranges of 55.840, 54.635 and 52.020. However, if the price receives support from the 57.600 zone, it could increase and reach our targets of 60.980 and 61.850; additionally, if it closes above 62.500, it might continue to move toward the ranges of 64.690, 65.710, 67.790-67.980, and even 69.100.
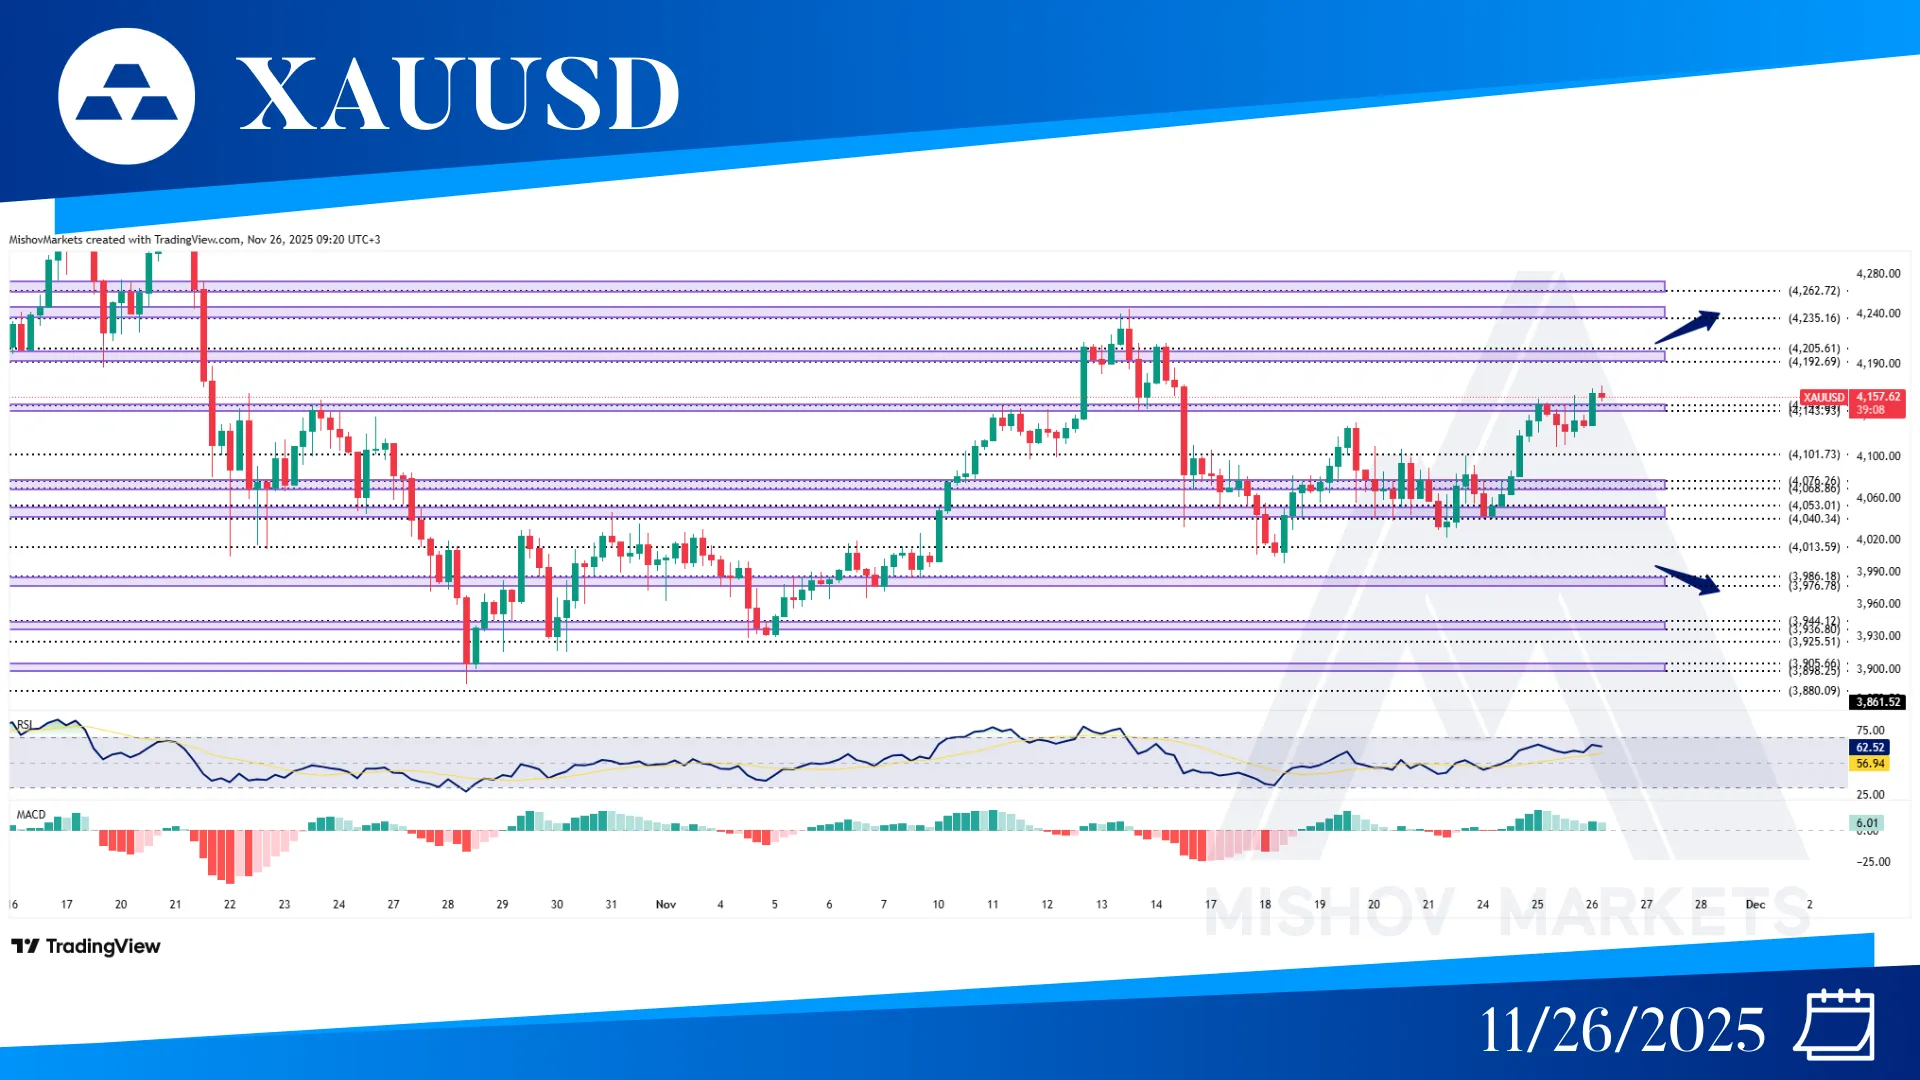
In XAUUSD, as precisely mentioned in Monday’s analysis, The 4040-4053 zone supported the price and it has started to increase and after providing a close above the 4132 level, it has reached our target at 4143-4149. Now if it breaks above the 4150 level with a close above 4171, then it could start to increase toward 4185, 4192-4205, 4235, 4262, and even 4331. But if the 4192-4205 zone acts as resistance, then it could start to decrease toward the 4101 and 4076-4068 zones to receive support. However, if the price continues to decrease and the 4013 level fails to provide support, closing below 3997 could lead to a decline toward our target levels of 3986-3976, 3944-3936, and 3925. Furthermore, if it breaks below 3925, then it could continue to move toward 3880, 3861, 3846-3839, 3821, 3806-3804, and 3782.
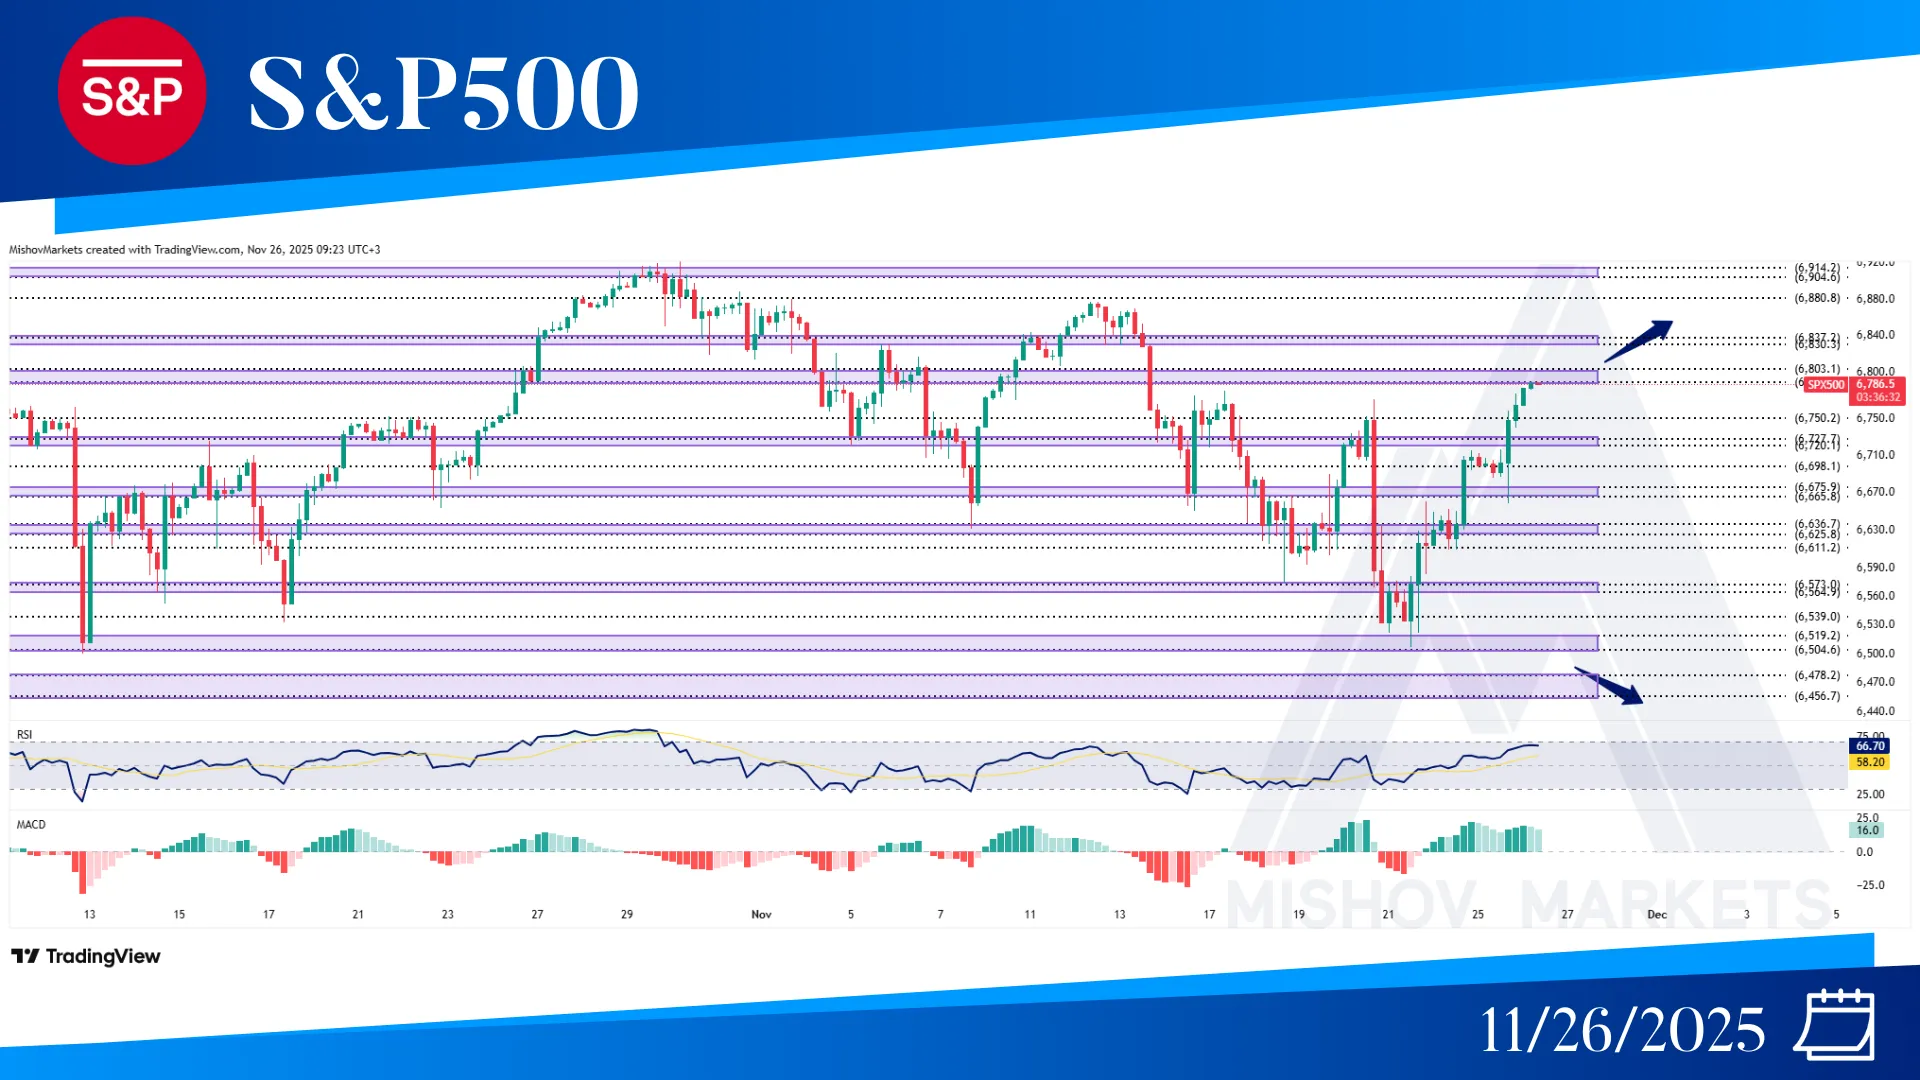
In the S&P 500, as precisely mentioned in Monday’s analysis, the 6519-6504 zone supported the price, and it has increased and reached our targets at the 6635, 6675-6665, 6698, 6727-6720, and 6788-6803 zones. Now if the price continues to increase, it could reach the targets at the 6830-6837, 6880, 6914, 6939, 6978, and 7019-7031 zones. But if the 6788-6837 zone acts as resistance, the price could decrease toward the 6750, 6727-6720, 6698, and 6675-6665 zones to receive support from them.
