


Market Analysis 24 Sep 2025

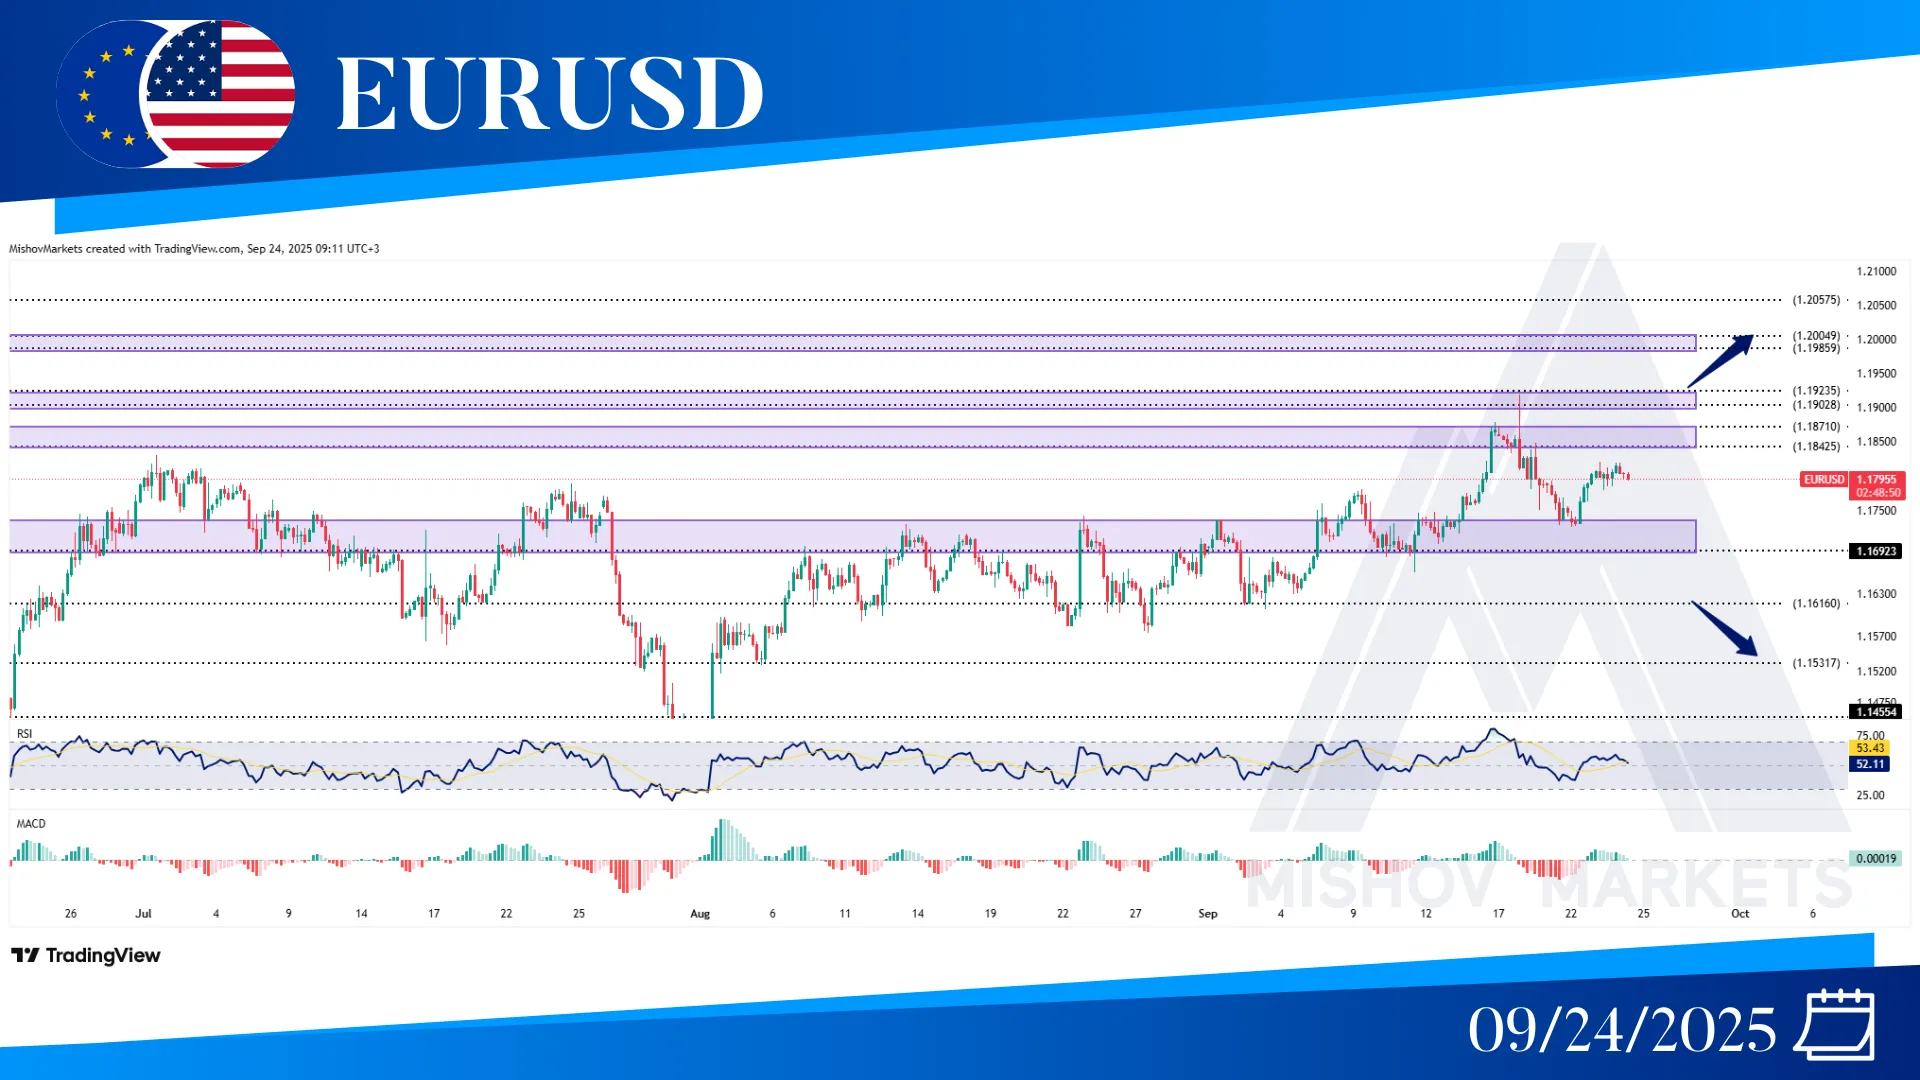
In EURUSD, as precisely mentioned in Monday’s analysis, the price tested the 1.17500-1.17000 zone and received support from it. Now the price has started to increase toward our targets, it could continue to increase and reach our next targets at 1.18420-1.18710, 1.19230, or possibly 1.20040. However, it might come back to retest the 1.17000 level and if this zone brakes then it will come back to aforementioned trading range (1.16160-1.17400), but if it falls below 1.16550, it could decrease to 1.15310, and then if this Level fails to support the price, it could decrease further toward our targets at 1.14550 and 1.13540-1.13750 zones.
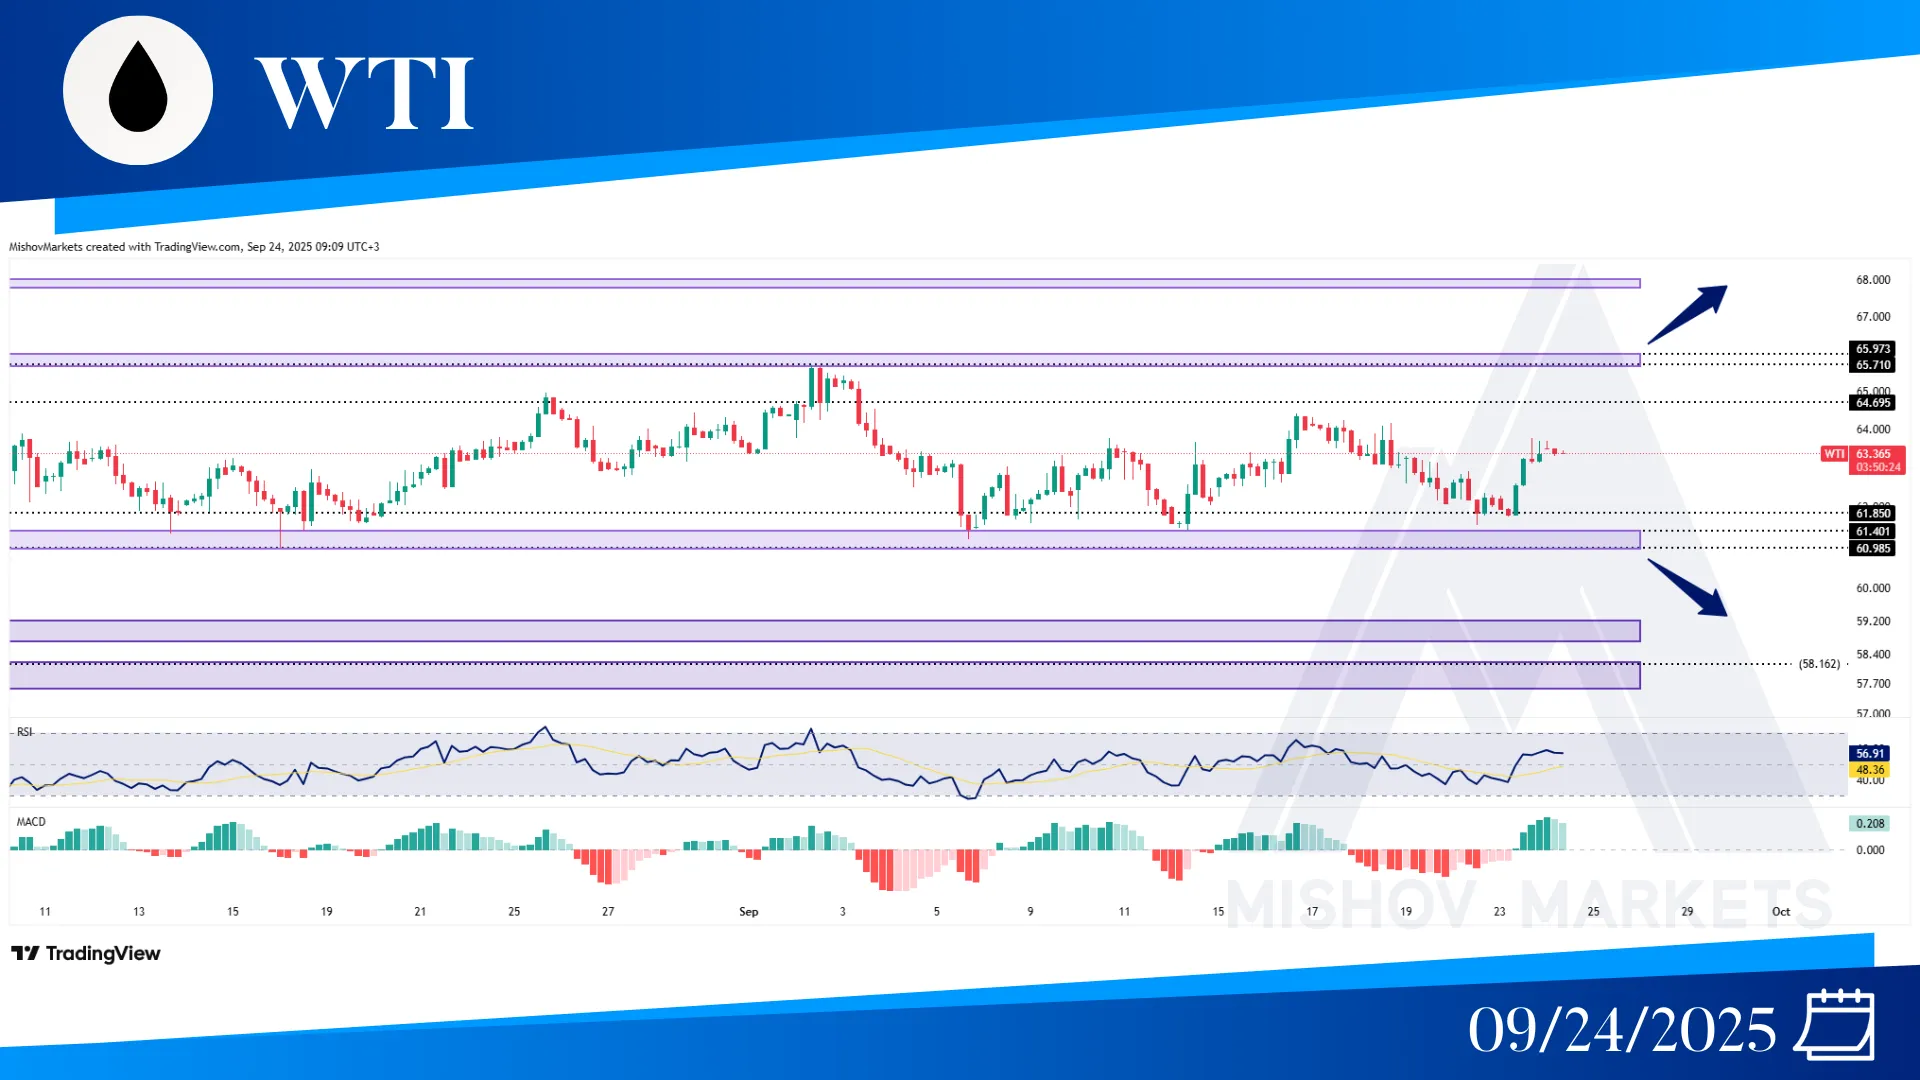
In WTI, as precisely mentioned in Monday's analysis, the price tested the 61.850 level and received support from it and the price returned to its trading range between 61.850-64.000. Now the price could continue to increase and reach to our targets at 64.690 and 65.700-65.970; additionally, if it breaks above the 65.710 level and closes above 66.100, it may continue to increase toward the ranges of 67.790-67.980 and 69.100. But it might face resistance and come back to test the 61.850 or 61.400-60.990, and if it fails to support the price then it could decrease further toward the ranges of 59.200-58.840 and 57.800-58.100.
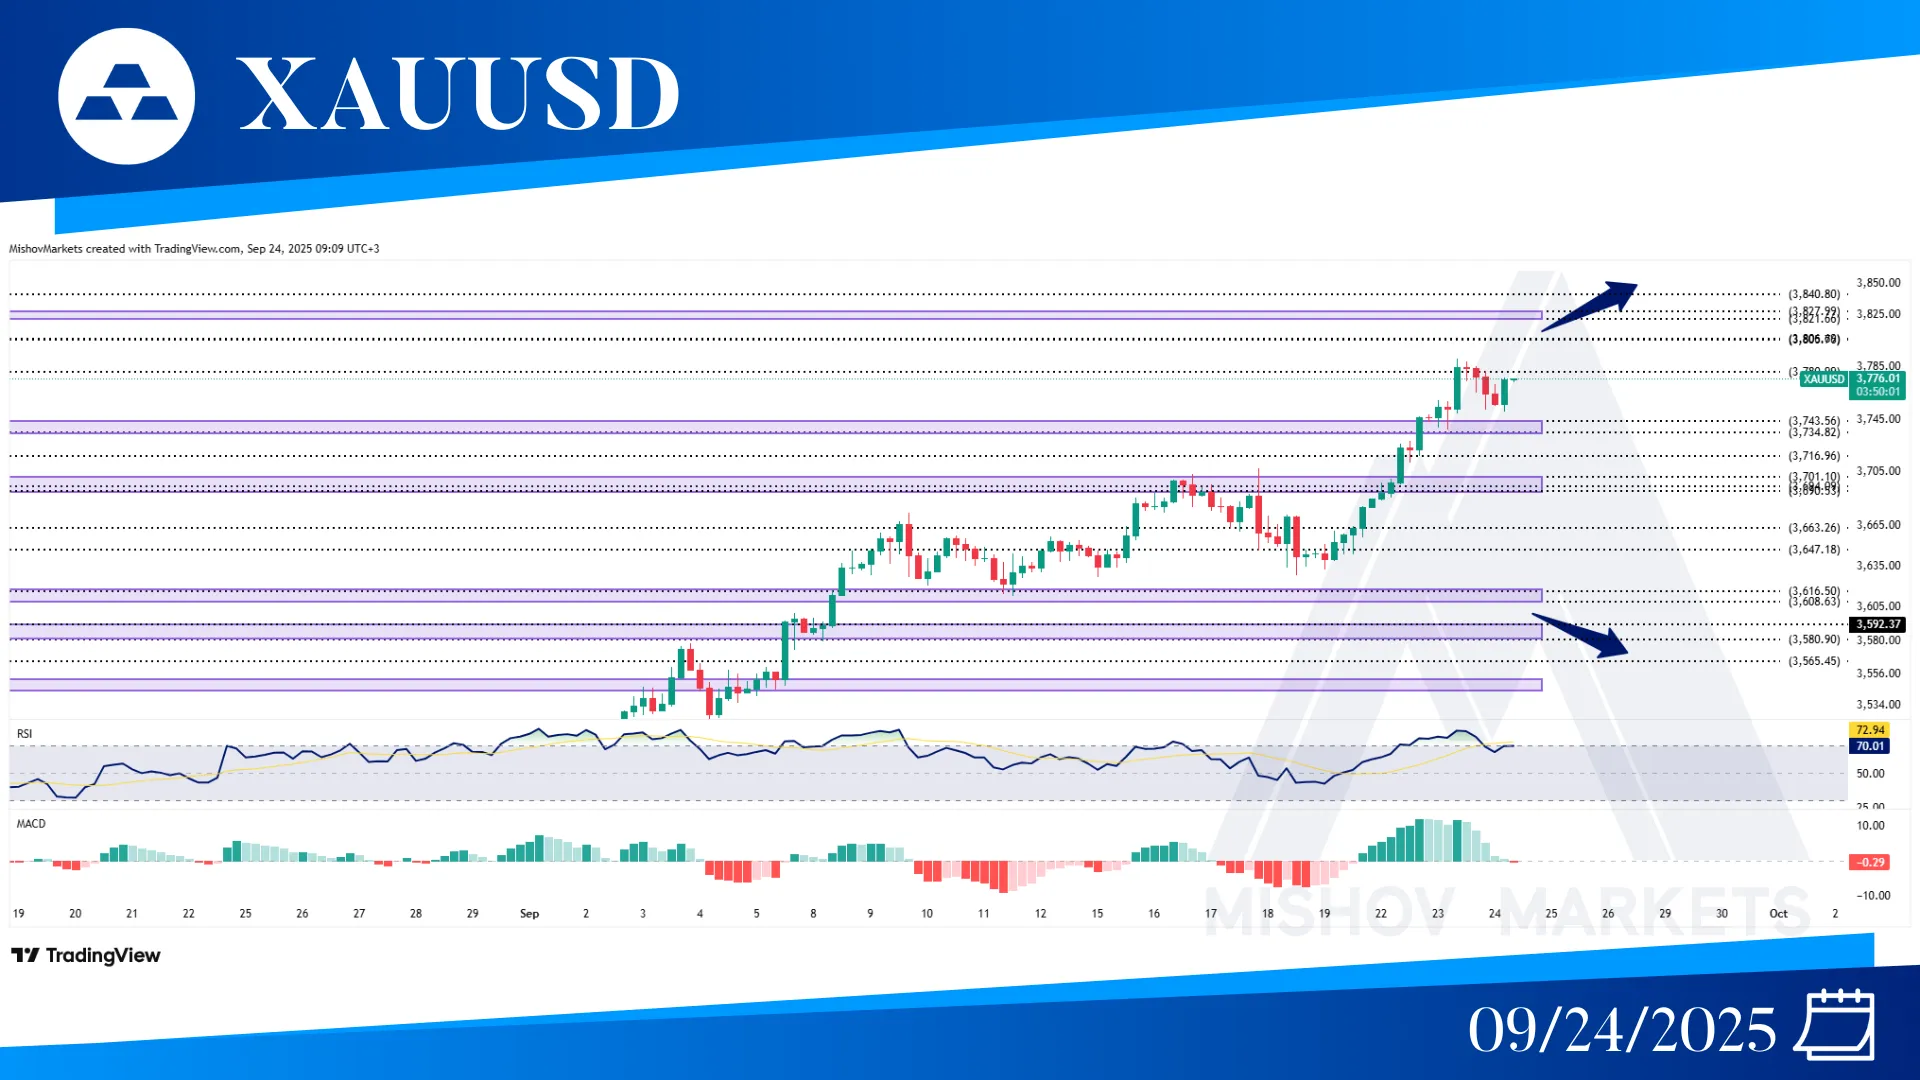
In XAUUSD, as precisely mentioned in Monday’s analysis, the price provided a close above the 3708, and continued to increase toward 3716, 3734-3743 and 3780 and the 3780 has acted as resistance for now and pushed the prices lower toward 3745 support zone. Now if the price increases and provides a close above the 3792 it could continue to increase toward 3806, 3821-3827 and 3840. But if the 3780 zone acts as resistance, then it could start to retrace some of its movements toward 3743-3734, 3716, 3701, and 3694-3690. And if it brakes below these zones then it could decrease further toward 3663, 3647, 3616-3608, and 3592.
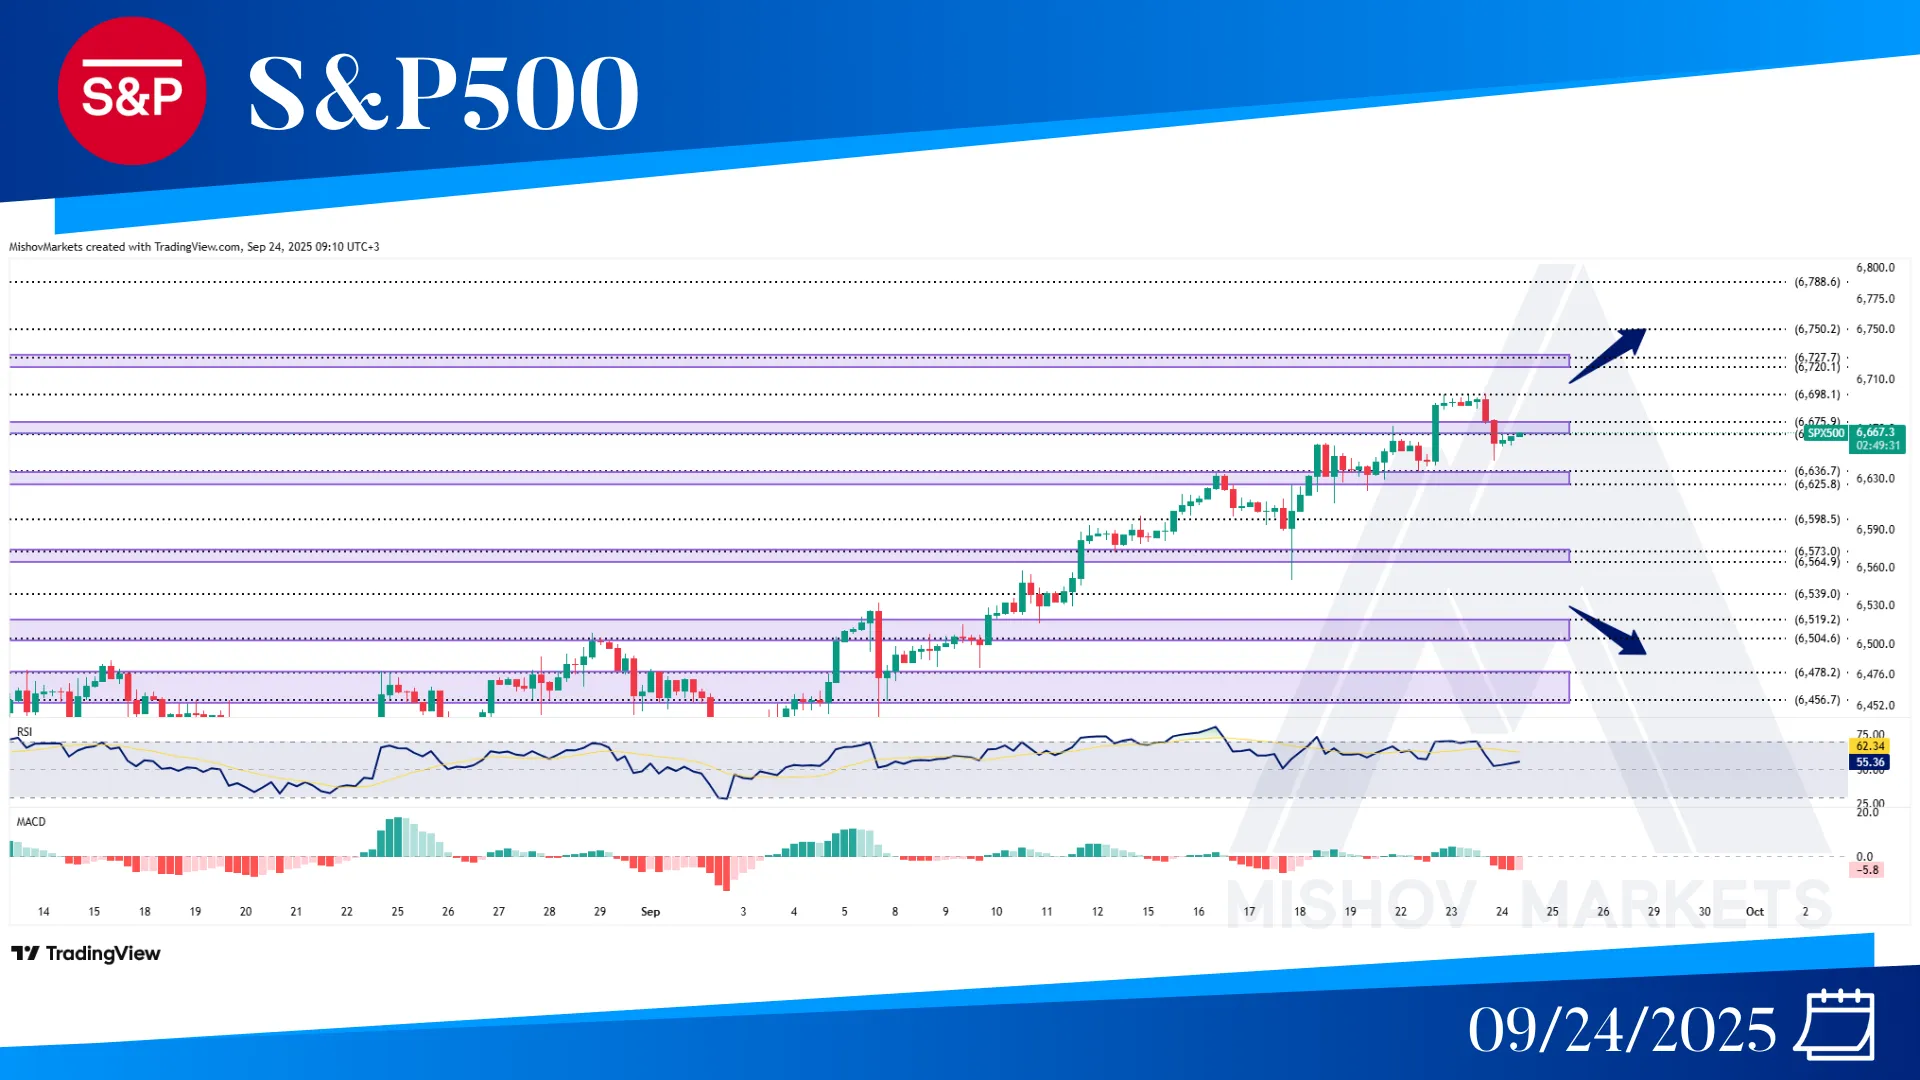
In the S&P 500, as precisely mentioned in Monday’s analysis; the price received support from the 6636 level and moved toward our targets at 6675 and 6698. Now the price has faced resistance at the 6698 level and is trying to receive support. Now if it provides a close above 6700, then it could continue to reach our next targets at 6720-6727, 6750 and 6788. But if the price faces resistance from this zone then it could start to decrease toward 6636-6625, 6598 and 6573-6564, and if any of these zones support the price then it could continue to increase and move toward our aforementioned targets. But if this zone fails to support the price then it decreases further toward our target at 6539, 6519-6504, 6478-6456 and 6418 to receive support, and if these zones also fail to do so then it could decrease further toward 6361-6364, 6335-6326, 6300.
