


Market Analysis 23 Feb 2026

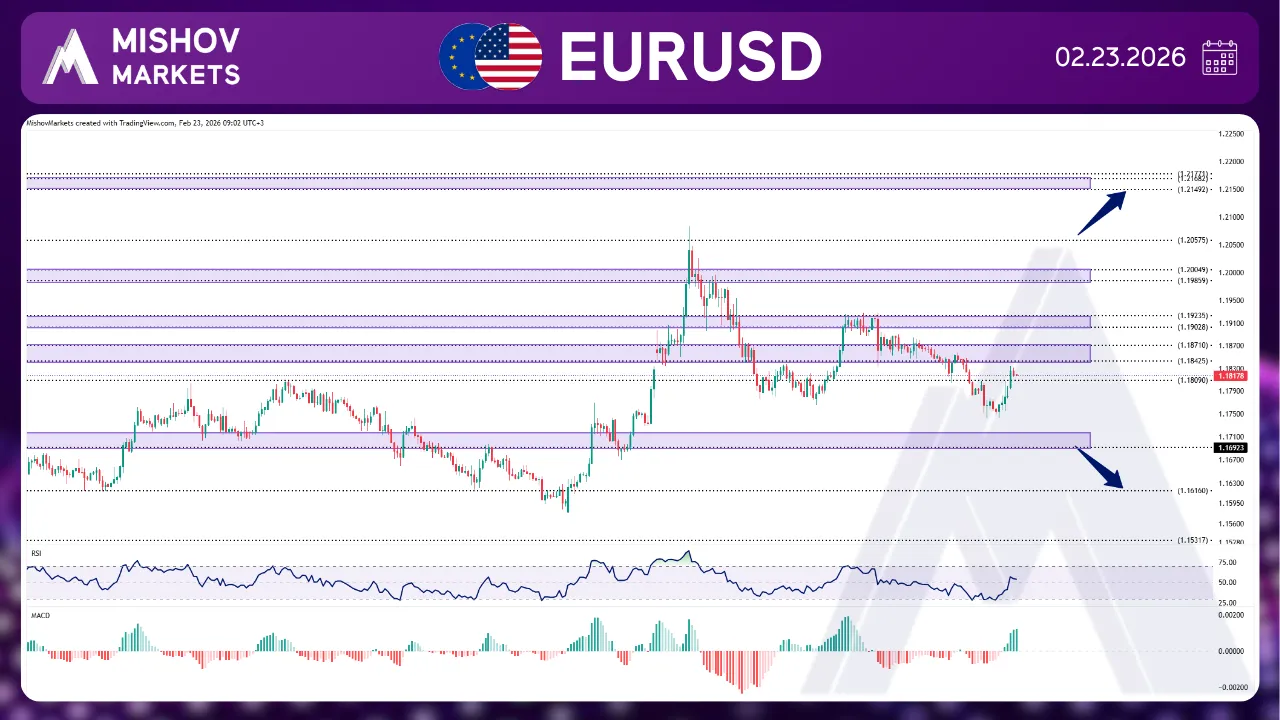
In EURUSD, as mentioned in Wednesday’s analysis, the 1.18100 level failed to hold as support, prompting a decline toward 1.17500. The price is now trading back around the 1.18100 area. If bullish momentum resumes, a breakout above the 1.19020–1.19230 zone could pave the way for further upside toward 1.19850–1.20040 and 1.20575. In addition, a daily close above 1.20850 may extend the advance toward 1.21490–1.21770 and 1.23140. On the downside, a confirmed close below 1.17400 could trigger a move toward 1.17200. Should this level fail to hold and 1.16160 also break, downside pressure may intensify, pushing the pair toward 1.15320 and potentially lower to 1.14950, 1.13540–1.13750, and 1.13150–1.12890.
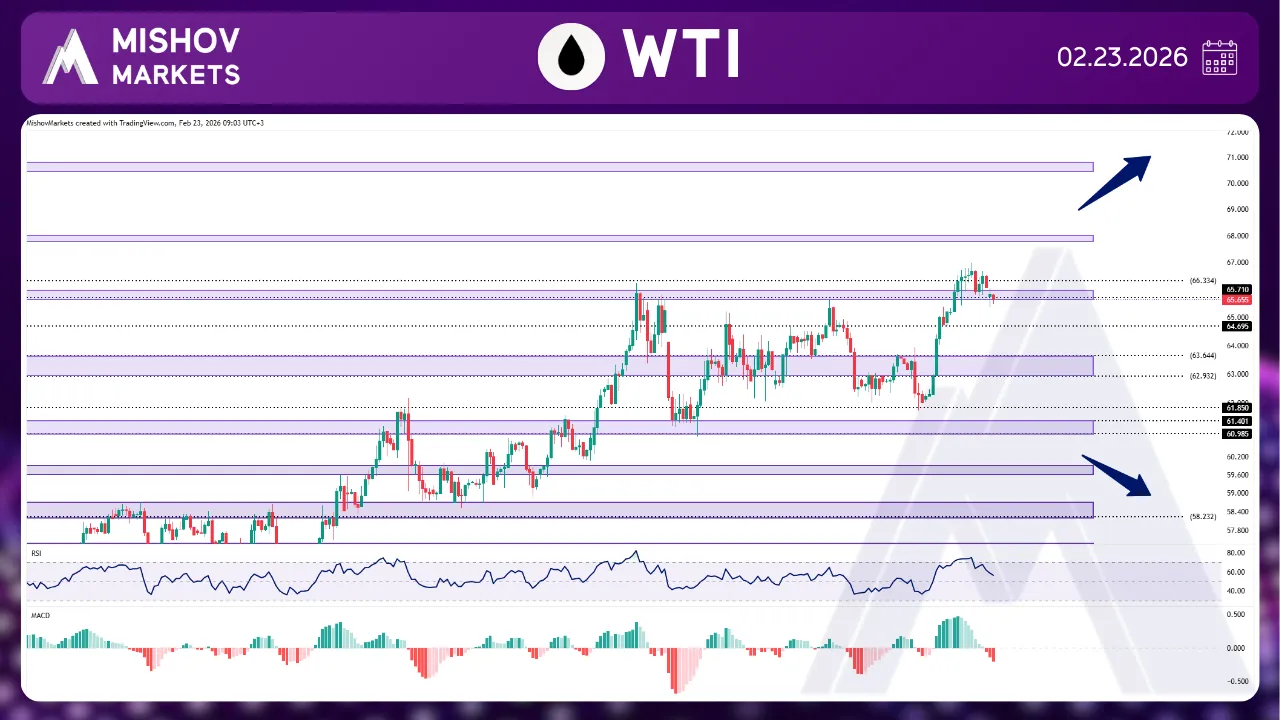
In WTI, as precisely mentioned in Wednesday’s analysis, the 61.850 level provided solid support, and following a breakout above the 62.900–63.400 zone with a close above 63.950, the price advanced toward our targets at 64.695, 65.710–65.980, and 66.330. At this stage, if bullish momentum persists and the price breaks above the 66.330 level with a confirmed close above 67.000, further upside could unfold toward the 67.790–67.980, 69.100, and 70.640–70.860 targets. On the downside, if the 65.710 or 64.690 zones fail to hold as support, the price may retreat toward the 63.650–62.900 area to seek support. Moreover, a breakdown below the 61.400–60.985 zone accompanied by a close under 60.600 could accelerate price decline toward 59.930–59.600, 58.700–58.230, 56.570–56.180, 54.630, 52.020, and ultimately 49.880.
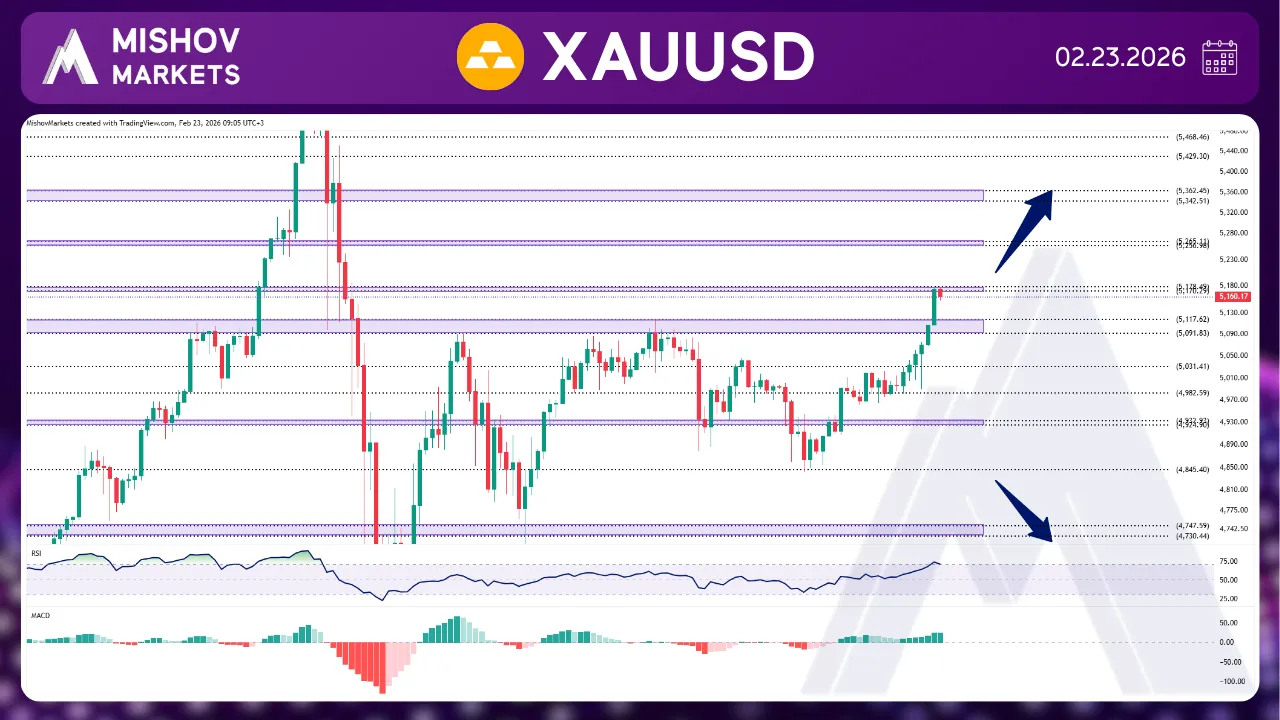
In XAUUSD, As precisely mentioned in Wednesday’s analysis, The price found support at the 4845 level and, after breaking above the 4924–4932 zone, extended its upward move to reach our targets at 4982 and 5031. Following a confirmed breakout above this area with a close above 5047, the bullish momentum continued, pushing the price toward our upside targets at 5091–5117 and 5170–5178. At this stage, if the price maintains its upward trajectory and breaks above the 5178 zone, further gains could be expected toward the 5256–5265, 5342–5362, 5429, and 5567 levels. On the other hand, if resistance emerges around the 5170–5178 area, the price may undergo a corrective pullback toward 5117–5091 or 5031. Should these levels fail to provide support, a deeper decline toward 4983 or the 4924–4932 zone may follow. Additionally, a breakdown below 4845 could signal a renewed bearish move toward the support zones at 4747–4730, 4675–4665, 4614–4602, 4574–4566, and 4488–4482.
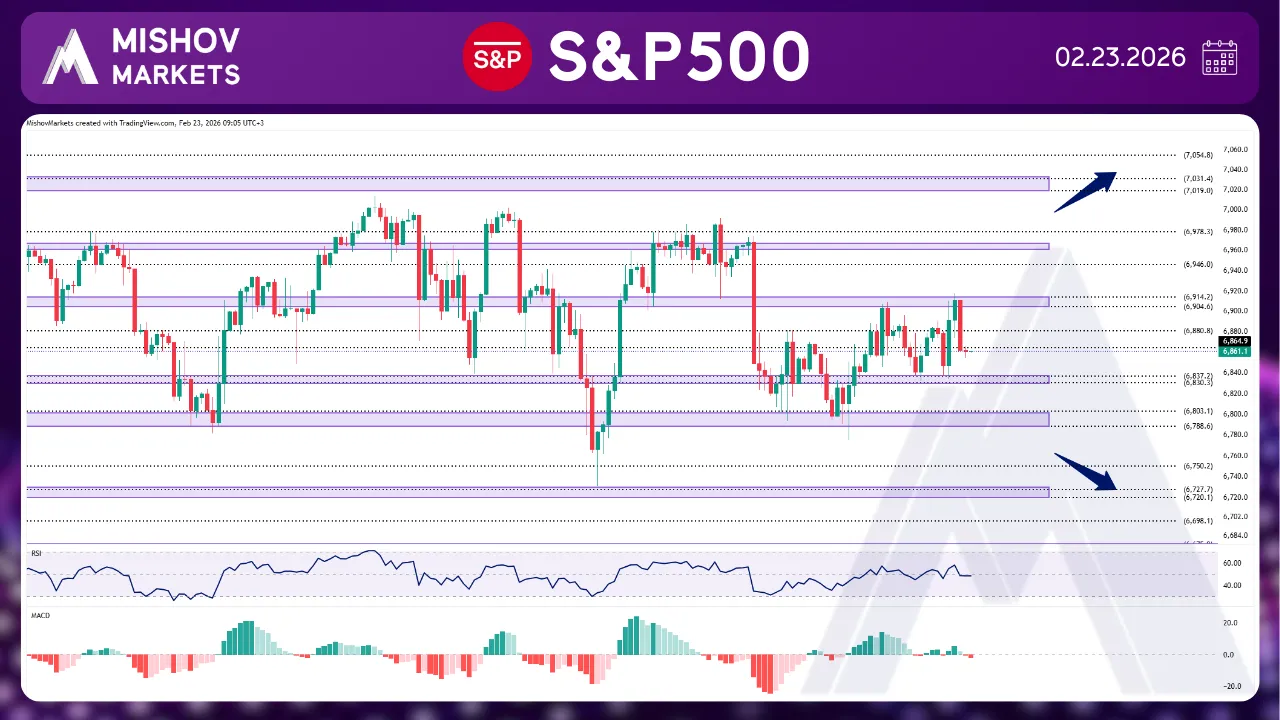
In the S&P 500, As precisely mentioned in Wednesday’s analysis, the price broke above the 6880 zone and reached our target at 6904-6914, and then after facing resistance, it has returned to the 6864 zone. At this point, if the price receives support from this zone and breaks above the 6904-6914 zone, it may advance toward the 6946, 6960-6966, and 6978 zones. Furthermore, a confirmed breakout above 6978, followed by a close above 6995, could potentially lead to new all-time highs at 7019–7031, 7054, and 7118–7141. Conversely, if the 6837–6830 or 6803–6788 zones fail to hold as support, the price could decline toward 6785. A further break below the 6727–6720 area may lead to deeper losses toward 6698, 6675–6665, 6636–6625, 6611, and 6573–6564.
