


Market Analysis 22 Sep 2025

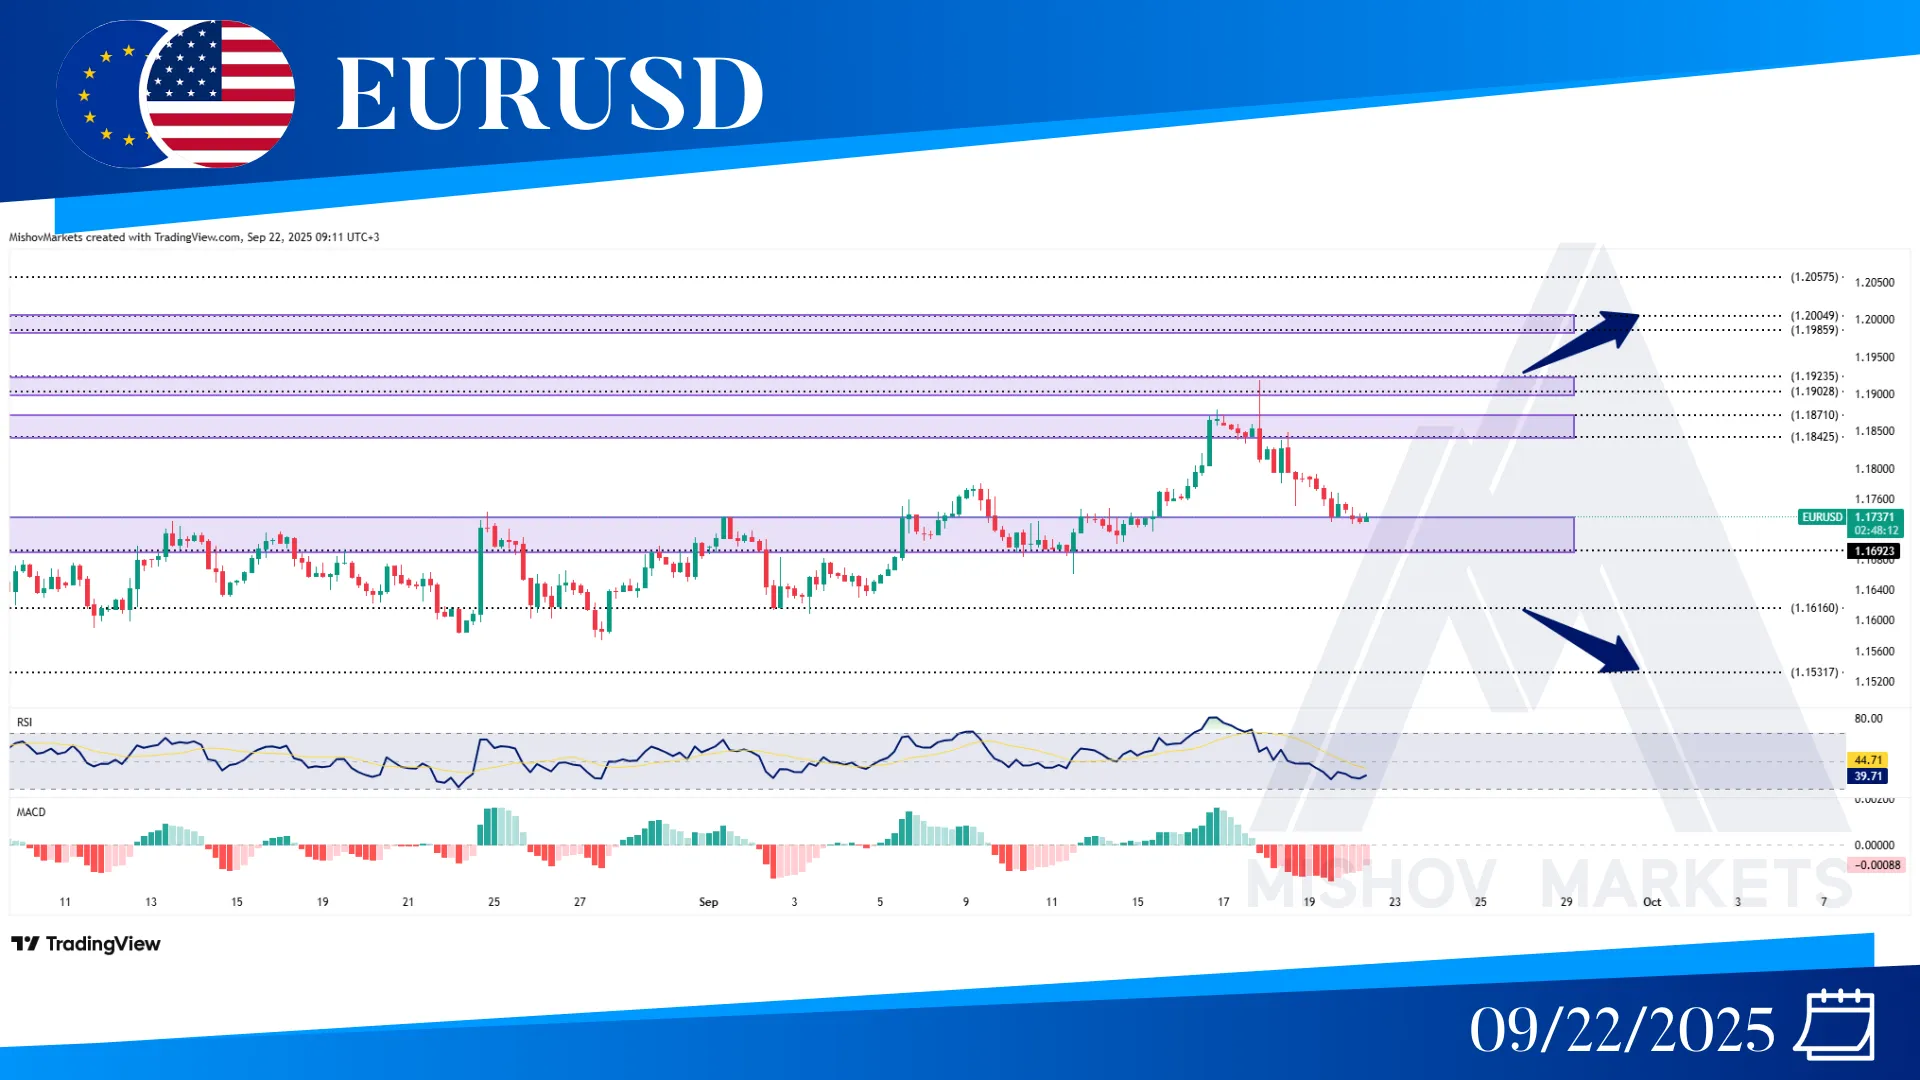
In EURUSD, as precisely mentioned in Wednesday’s analysis, the price continued to increase, reaching our target range of 1.19020 to 1.19230. Now it has faced resistance at 1.19020-1.19230 and has come back to test the 1.17500-1.17000 zone to receive support from it, then it could continue to increase and reach our next targets at 1.18420-1.18710, 1.19230, or possibly 1.20040. However, it might come back to the aforementioned trading range (1.16160-1.17400), but if it falls below 1.16550, it could decrease to 1.15310, and then if this Level fails to support the price, it could decrease further toward our targets at 1.14550 and 1.13540-1.13750 zones.
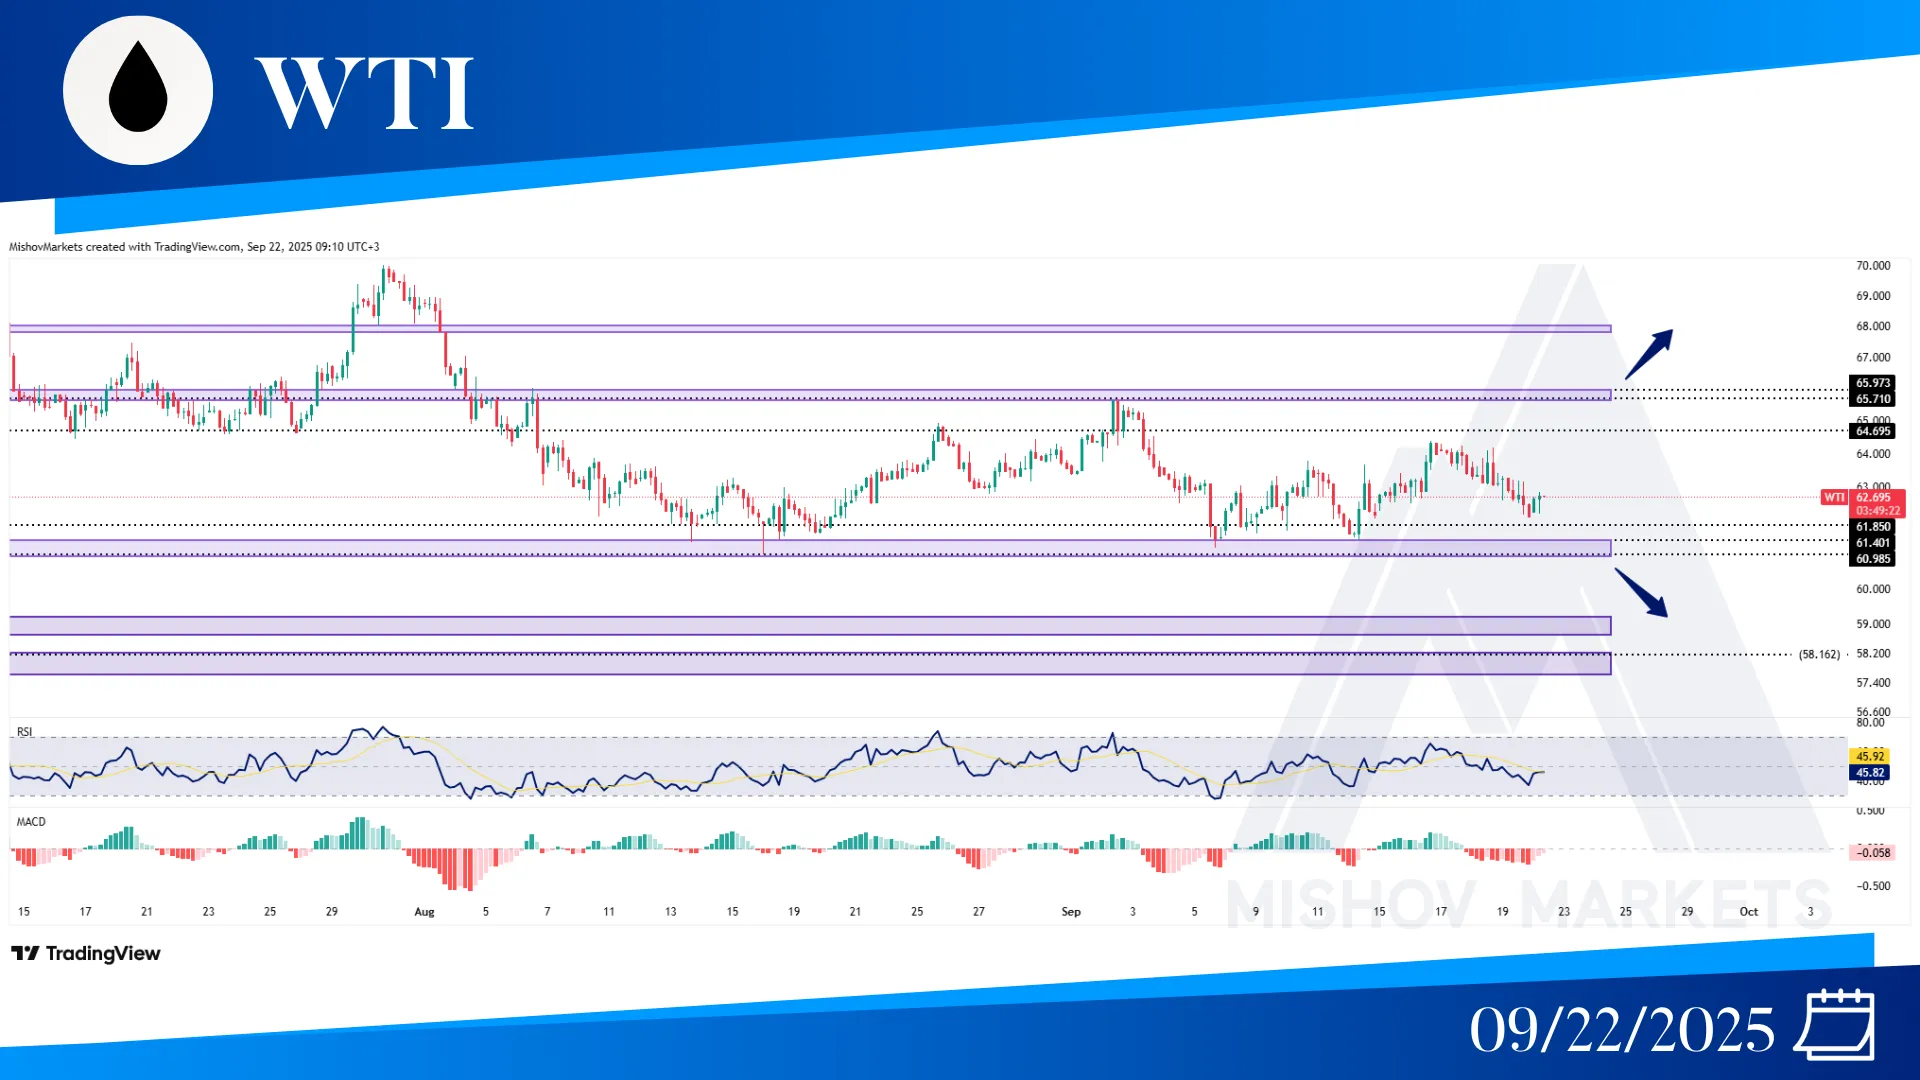
In WTI, the situation has remained unchanged since Wednesday's analysis, the price is trading in a range between 61.850-64.000. Now if the price could continue to increase and reach to our targets at 64.690 and 65.700-65.970; additionally, if it breaks above the 65.710 level and closes above 66.100, it may continue to increase toward the ranges of 67.790-67.980 and 69.100. But it might face resistance and come back to test the 61.850 or 61.400-60.990, and if it fails to support the price then it could decrease further toward the ranges of 59.200-58.840 and 57.800-58.100.
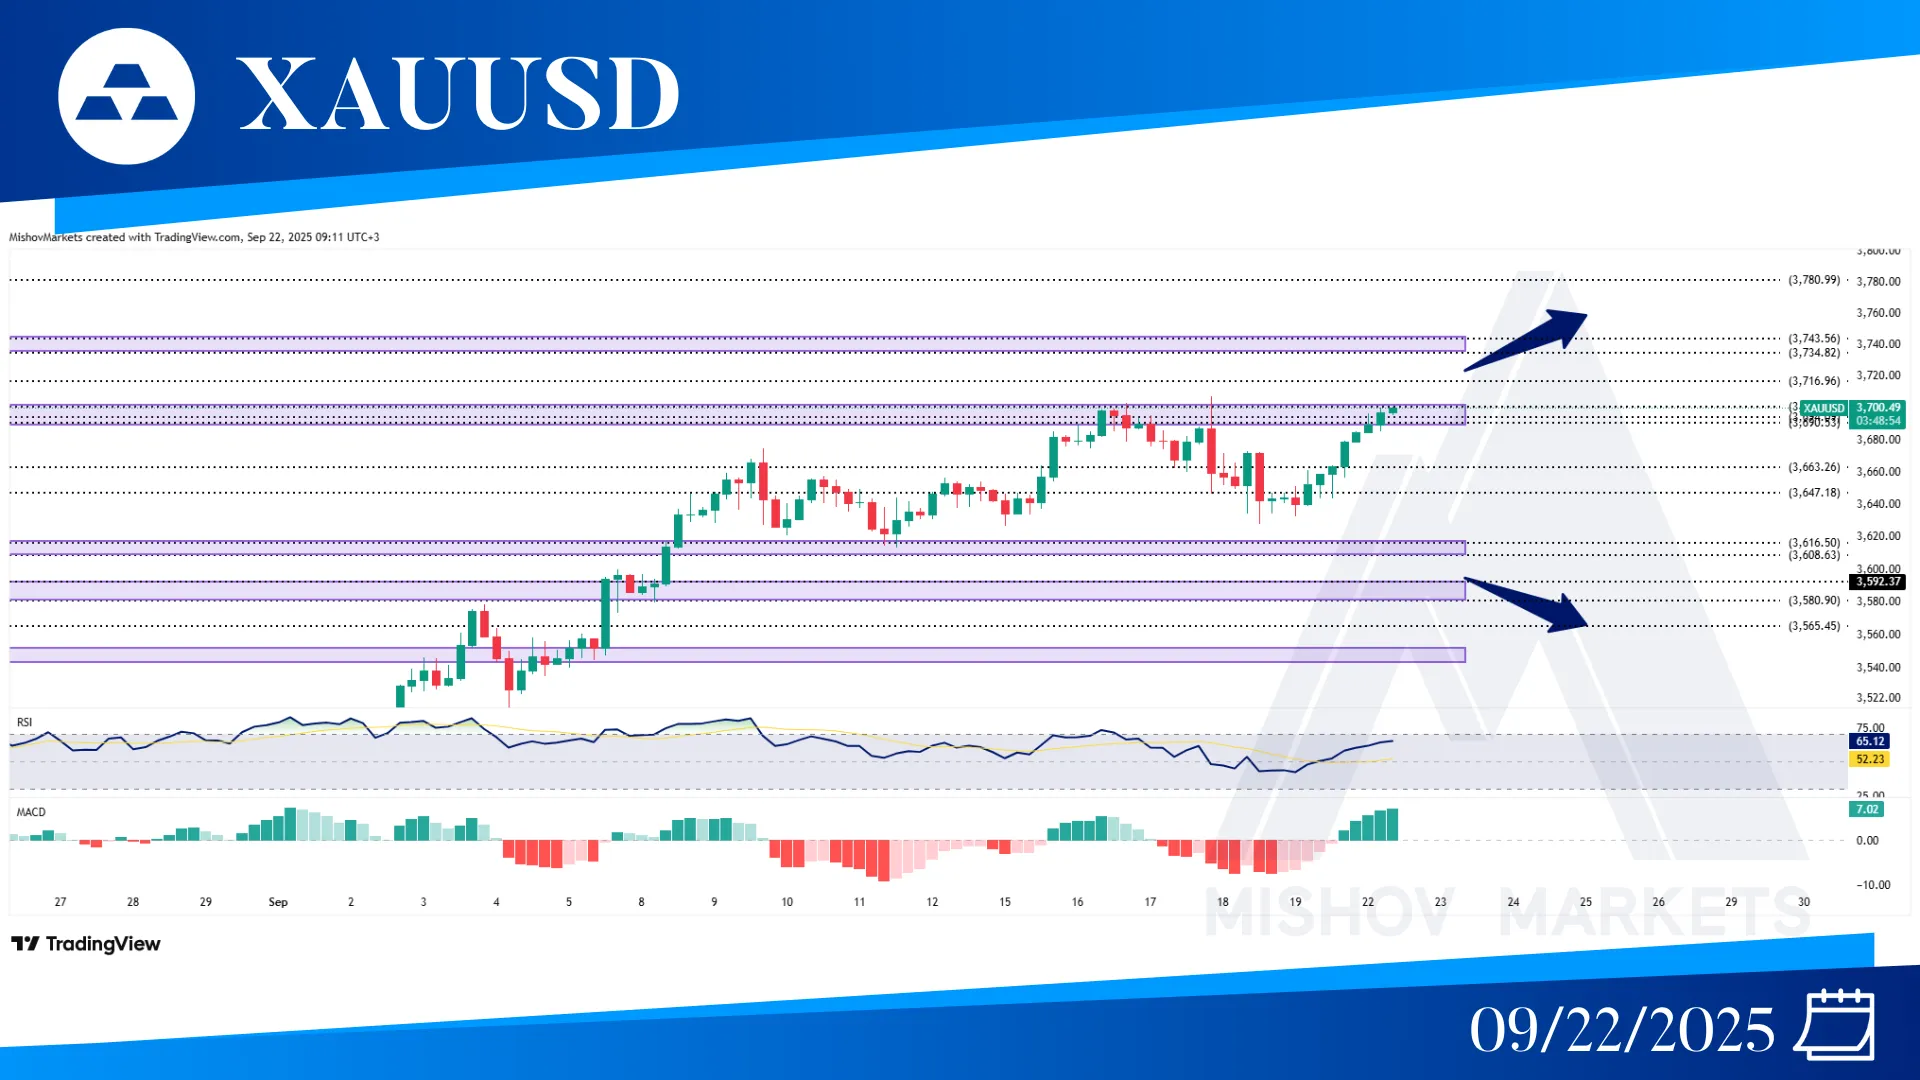
In XAUUSD, as precisely mentioned in Wednesday’s analysis, the price faced a resistance at 3701, and after a retest of the 3663 and 3647 support zones, the price has found momentum and is now moving toward the 3690-3694, 3701 target. Now if it provides a close above the 3708, then it could continue to increase toward 3716, 3734-3743, 3780, and 3827. But if the 3701 zone acts as resistance, then it could start to retrace some of its movements toward 3663, 3647, and 3616-3608. And if it brakes below these zones then it could decrease further toward 3592-3580, 3565, 3552-3546, 3511, 3501-3490 and 3483 to receive support. At this point if the 3461 fails to support the price then it could decrease further toward 3448, 3429, 3409-3400 and 3391-3387 zones.
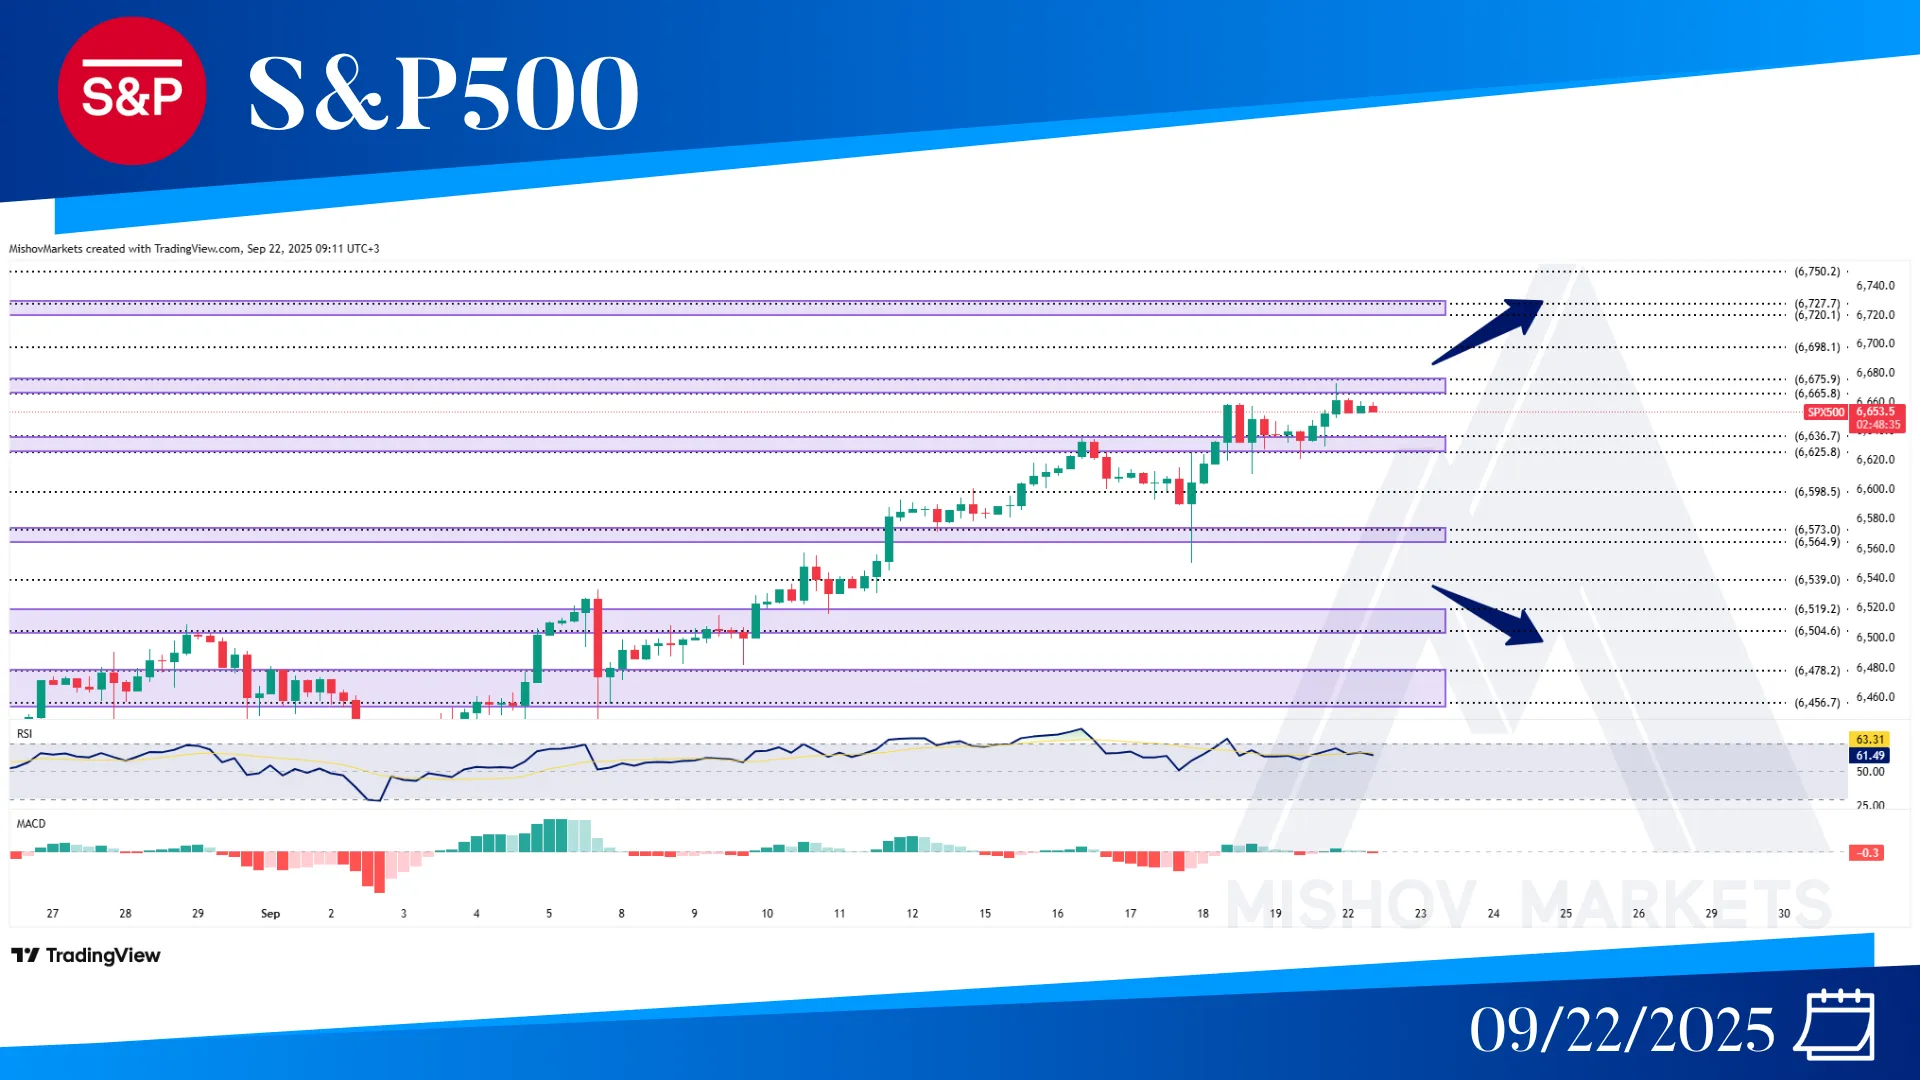
In the S&P 500, as precisely mentioned in Wednesday’s analysis; After hitting resistance at the 6625-6636 zone, the price fell to our targets at 6598 and the 6573-6564 zone. Finding support there, it reversed and provided a close above 6638, reaching our next target in the 6665-6675 zone. Now if the price face resistance from this zone then it could start to decrease toward 6636-6625, 6598 and 6573-6564, and if any of these zones support the price then it could continue to increase and move toward our targets at 6665-6675, 6698, 6720-6727 and 6750. But if this zone fails to support the price then it decreases further toward our target at 6539, 6519-6504, 6478-6456 and 6418 to receive support, and if these zones also fails to do so then it could decrease further toward 6361-6364, 6335-6326, 6300.
