


Market Analysis 22 Dec 2025

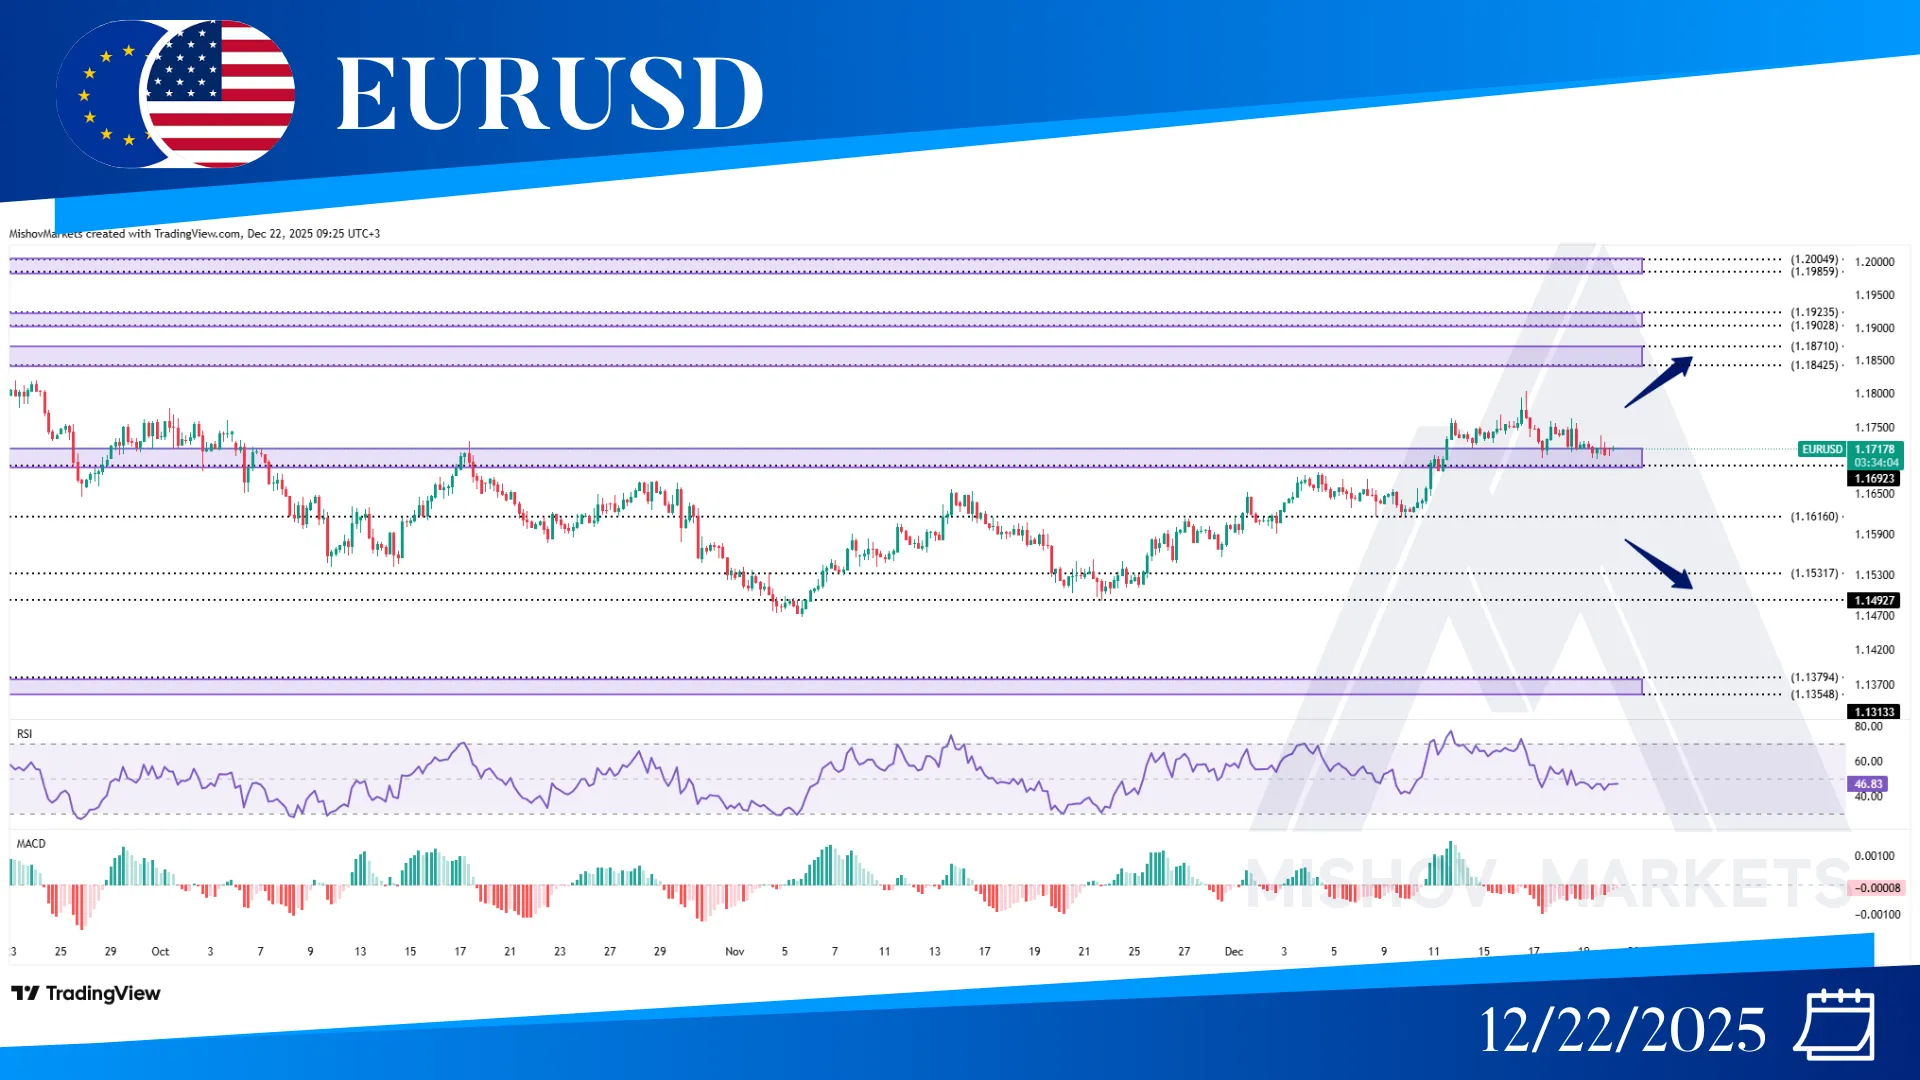
In EURUSD, as mentioned in Wednesday's analysis, the price is still trying to test and receive support from the 1.16920-1.17150 zone. Now if this zone supports the price and it continues to increase with a close above 1.18050, it could continue to reach our targets at 1.18420–1.18710, 1.19230, or possibly 1.20040. However, if the 1.16920 level fails to support the price, along with the 1.16160 level also failing to support it, the price could decrease further to reach targets at the 1.14950, 1.13540–1.13750, and 1.13150–1.12890 zones.
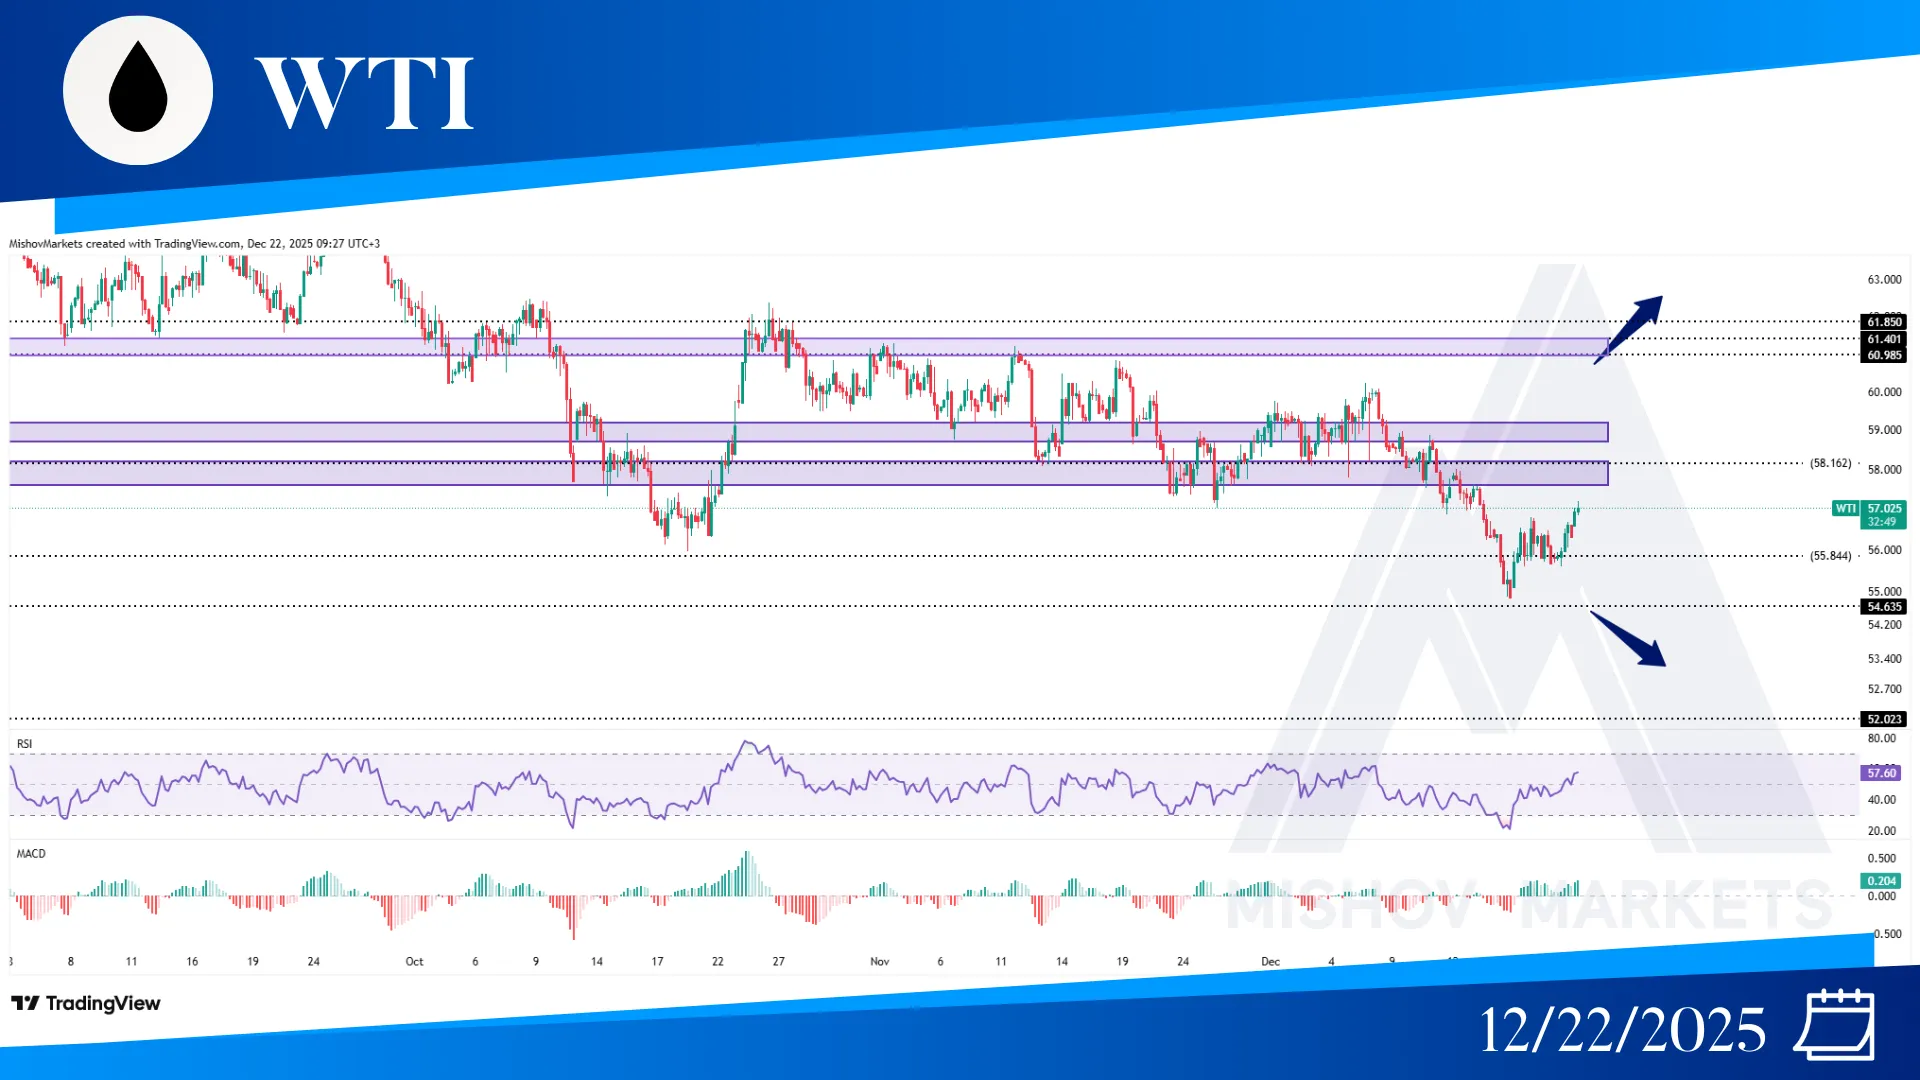
In WTI, as precisely mentioned in Wednesday's analysis, the price received support and reached our next level at 55.840. Now that the price has received support from this zone and started to increase, it could reach our targets at 57.660–58.150, 58.700–59.200, 60.980, and 61.850. If it provides a close above 62.500, then it might continue to move toward the ranges of 64.690, 65.710, 67.790-67.980, and even 69.100. But if the price provides a close below the 54.850 level, then it could decrease further toward the ranges of 54.630, 52.020 and 49.880.
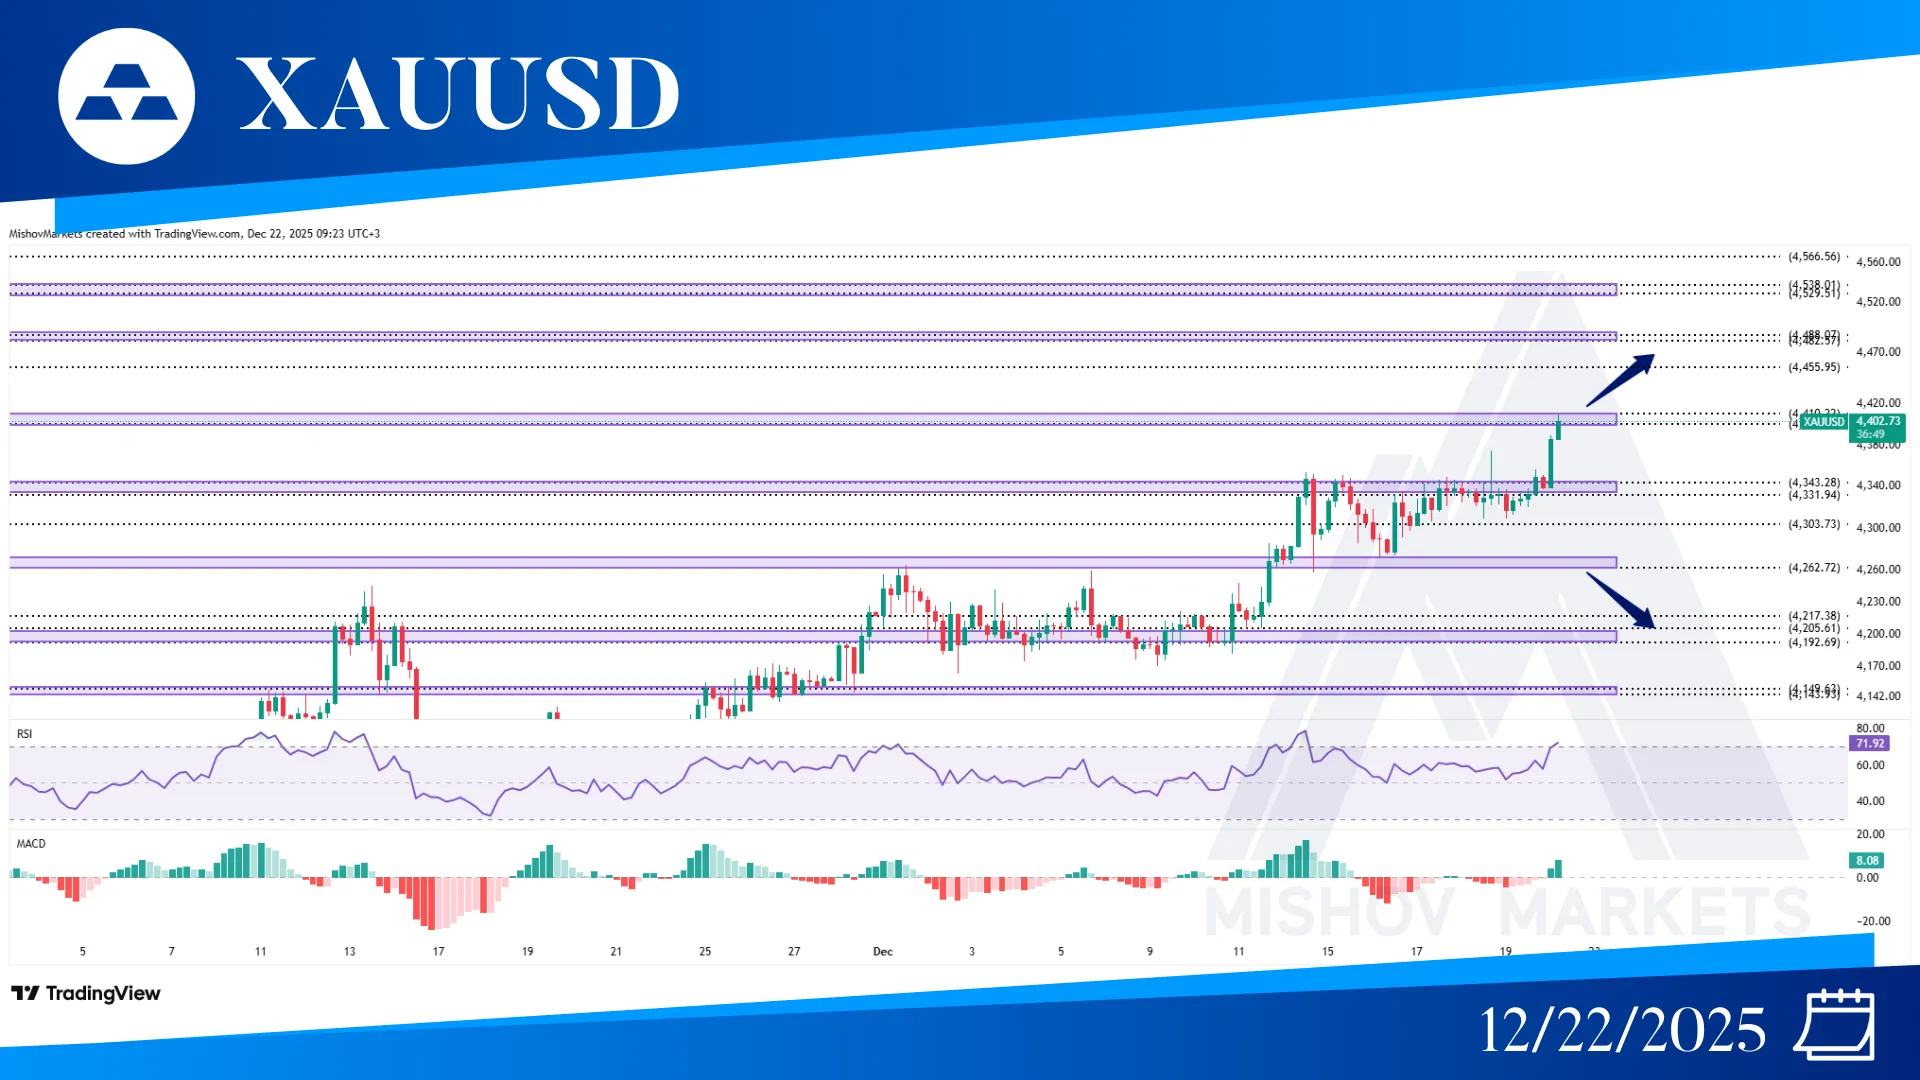
In XAUUSD, as precisely mentioned in Wednesday’s analysis. The price continued to increase and broke above the 4353 zone with a close above 4385 and reached our target at 4399-4410. Now if the price continues to increase and breaks the 4410 level, it could continue to increase toward our targets at 4455, 4482-4488, and 4529-4538. But if the 4410-4399 zone acts as resistance and price may retreat to test support at the 4343-4331 zone, and a failure there, followed by a break below the 4262 level with a close below the 4255, then it could decrease toward 4235, 4205-4192, and 4149-4143 for support.
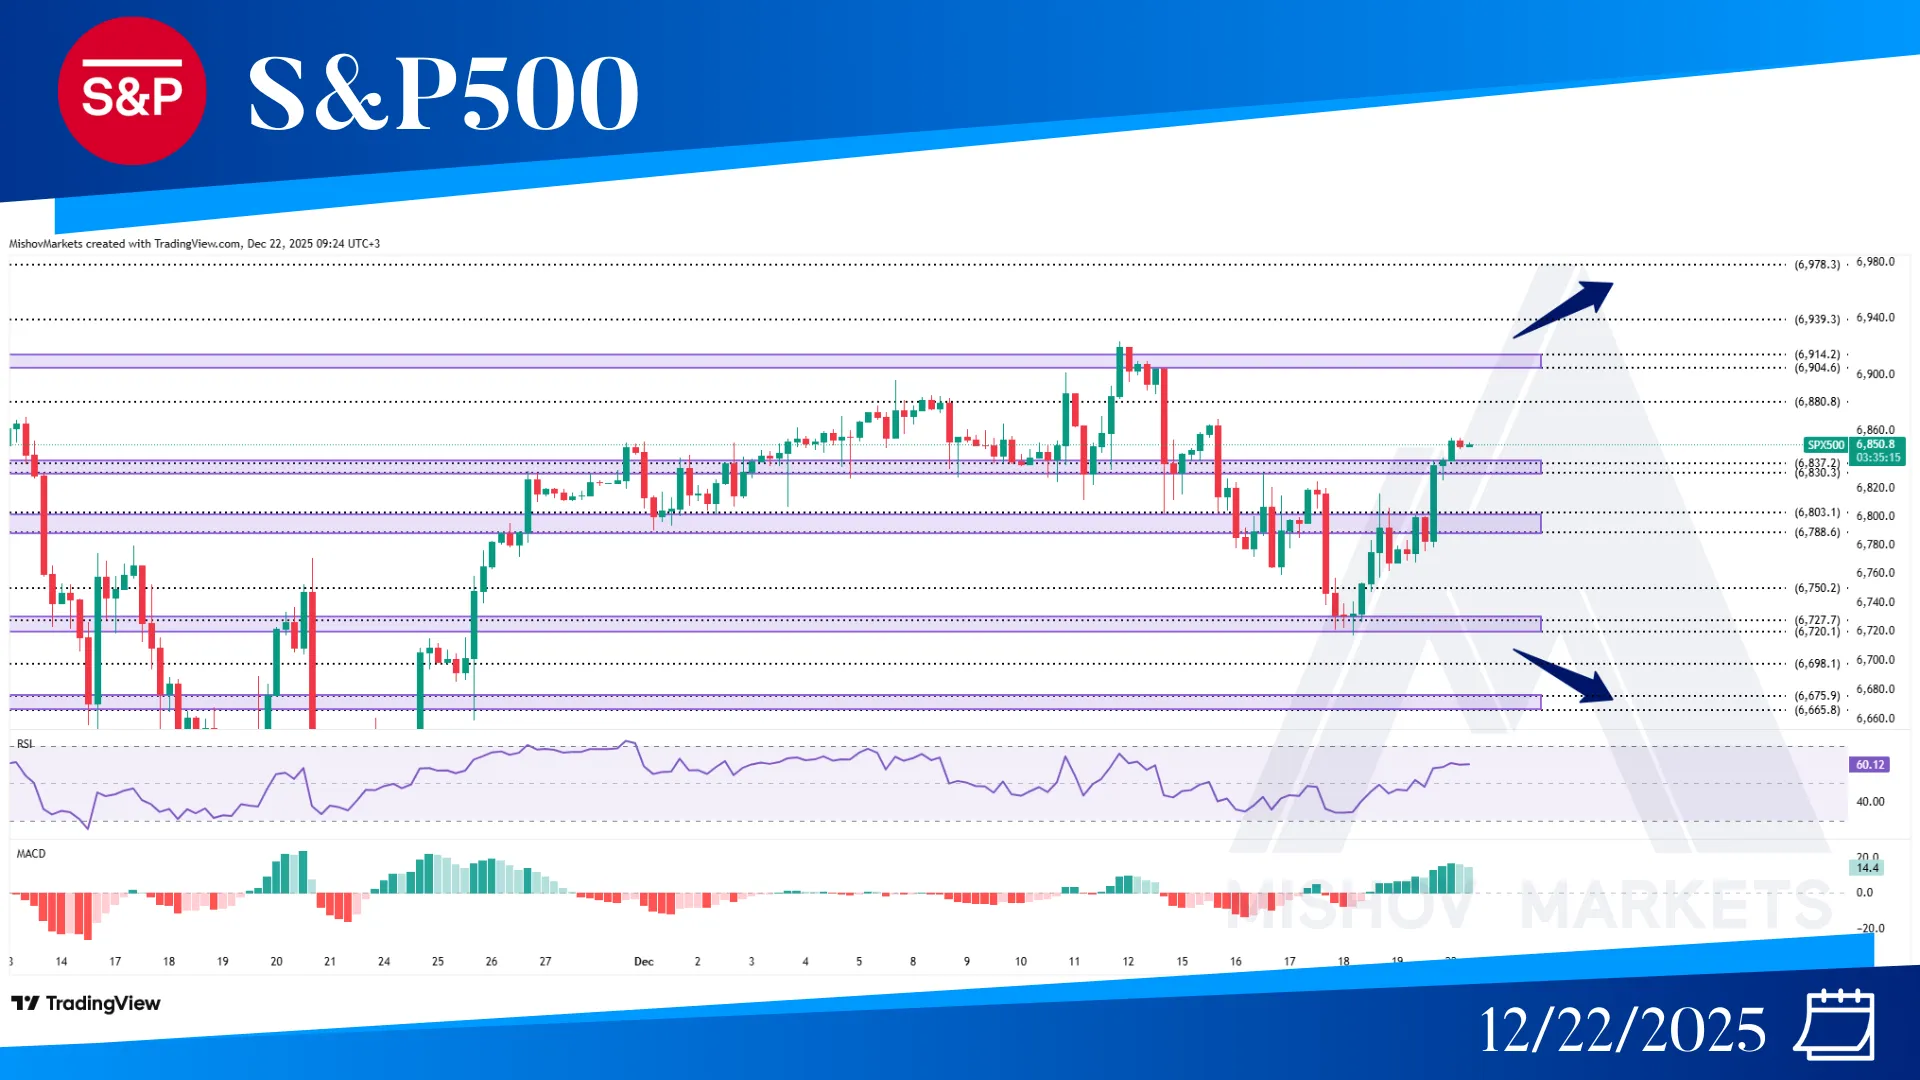
In the S&P 500, as precisely mentioned in Monday’s analysis, 6803-6788 acted as resistance, and the price continued to decrease and reach our targets at 6750 and 6727-6720. After receiving support from this zone, it has started to increase toward our bullish targets at 6788-6803 and 6830-6837. Now the price is trying to break above this zone, and if it provides a close above 6870, it could reach our targets at 6880 and 6914. Furthermore, if it continues to increase and provide a close above the 6930 level, it could reach our bullish targets at the 6939, 6978, and 7019-7031 zones. However, if the 6880 or the 6904-6914 range acts as resistance, the price could decrease toward the 6837-6830, 6803-6788, 6750, 6727-6720, 6698, and 6675-6665 zones to seek support.
