


Market Analysis 20 Oct 2025

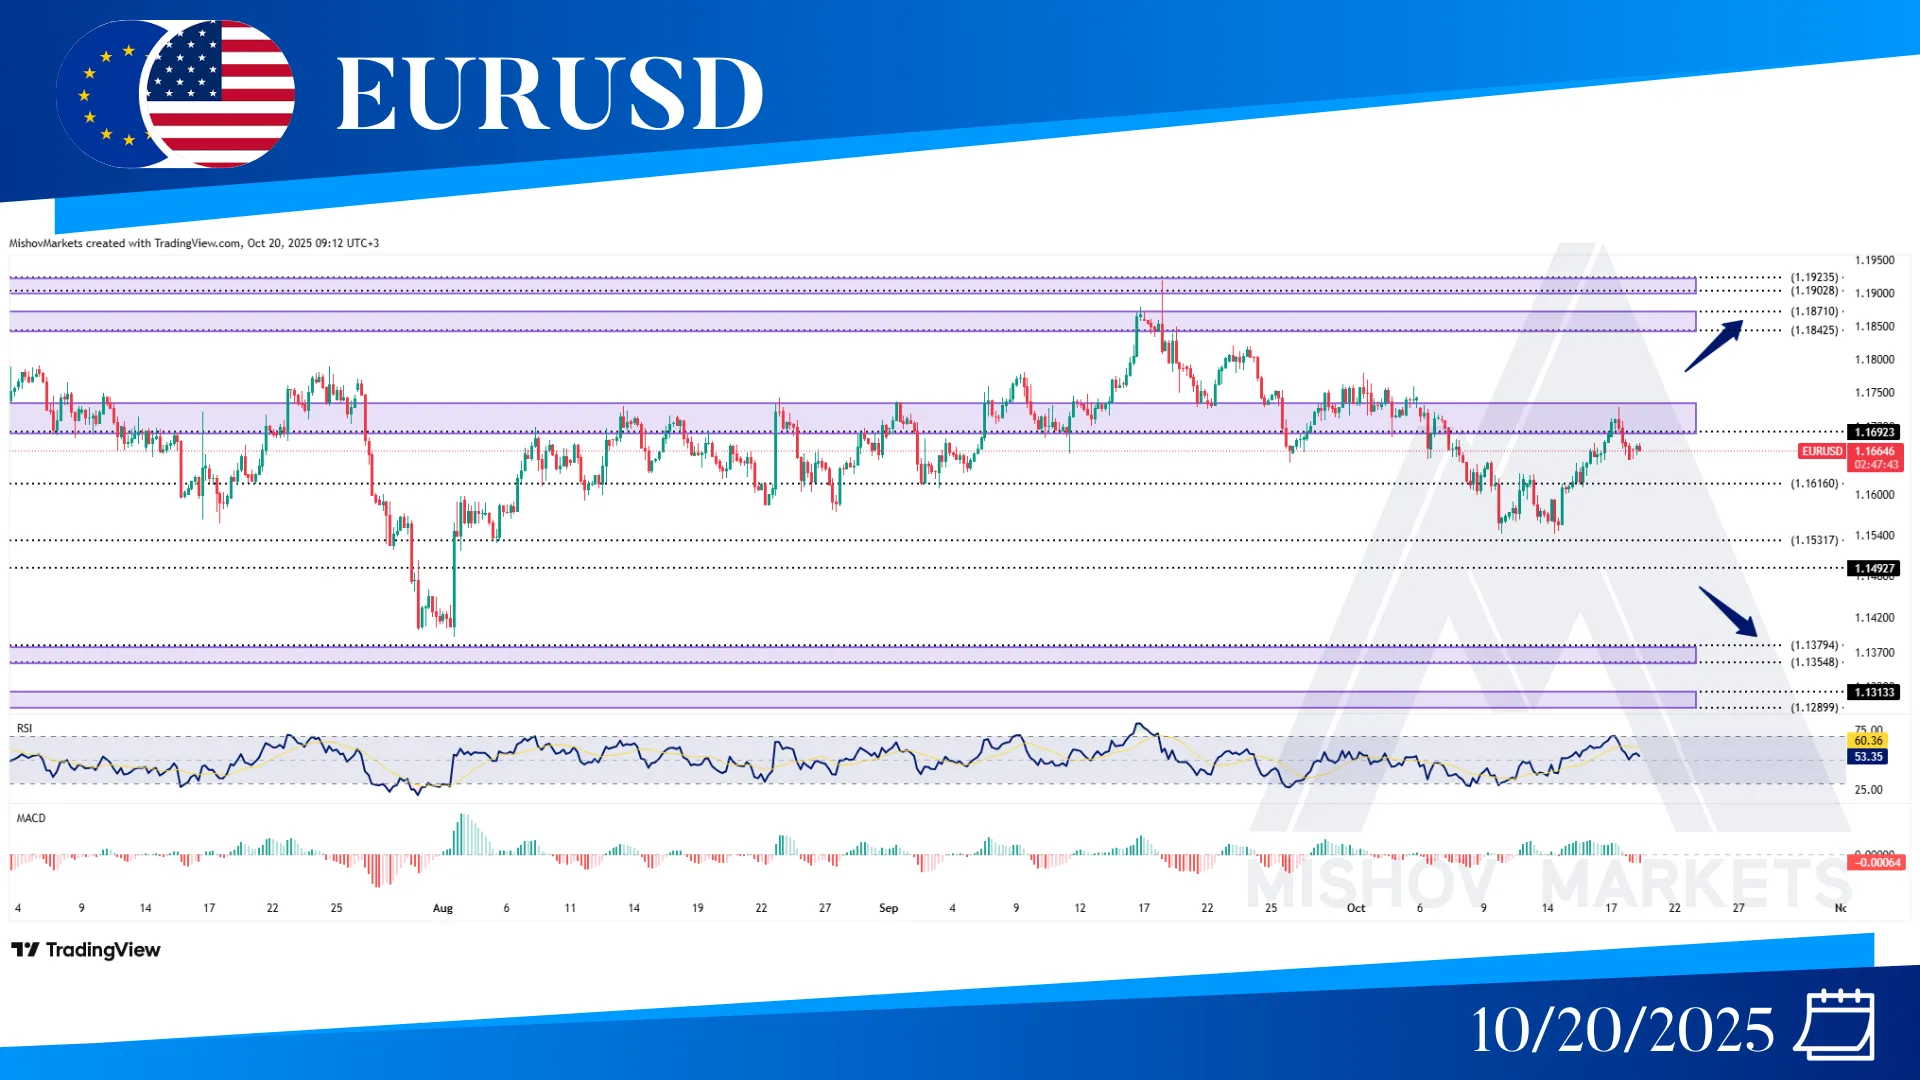
In EURUSD, as precisely mentioned in Wednesday's analysis, the price received support from the 1.16160 zone and started to increase toward our target at 1.17300. Now if the price faces resistance from this zone, it could come back to test 1.16160 and 1.15350. If these zones support the price and it continues to increase, it could start to reach our targets at 1.17300, 1.18420-1.18710, 1.19230, or possibly 1.20040. However, if the 1.15310 level does not support the price, it could decrease more to see the targets at the 1.14550 and 1.13540–1.13750 zones.
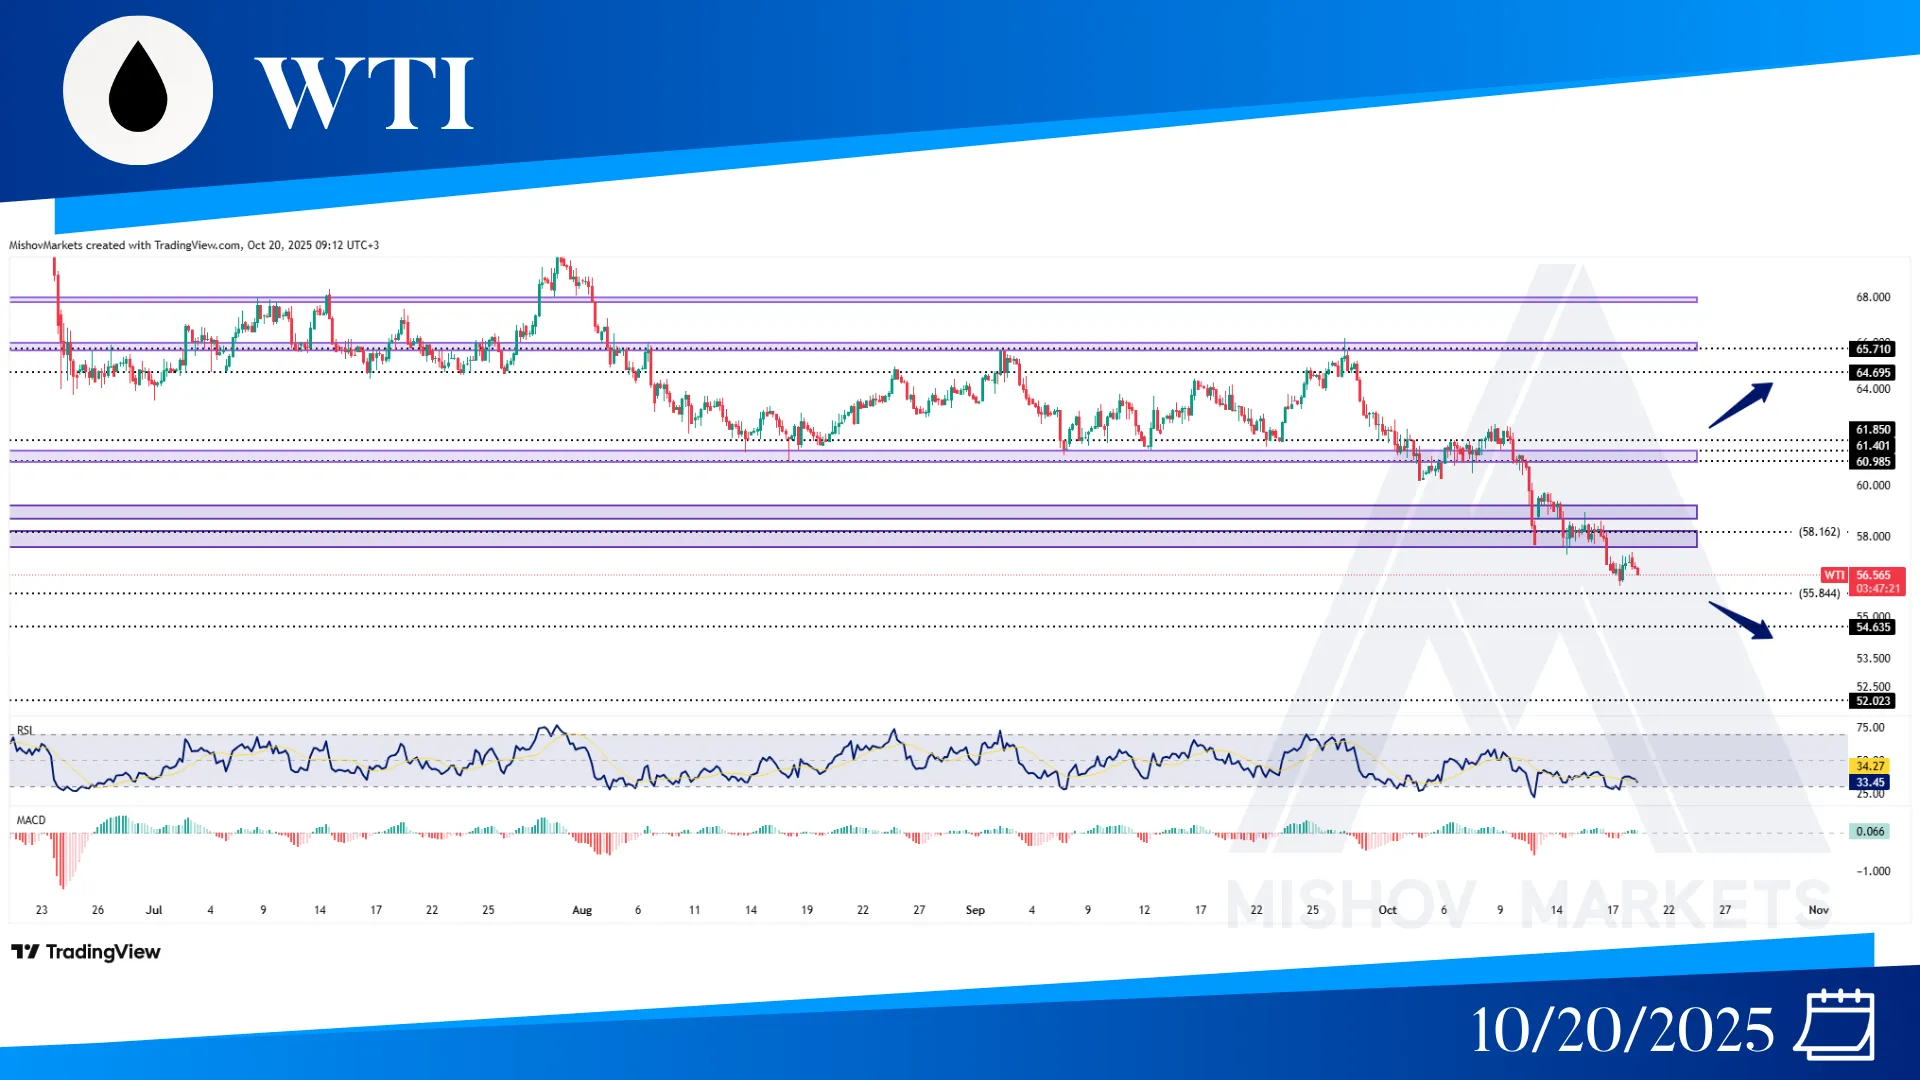
In WTI, as precisely mentioned in Wednesday's analysis, the 58.100-57.800 zone failed to support the price and it has started to decrease further toward the 55.840 level. If this zone acts as support, it may continue to increase toward the 58.160, 59.280, and 60.980–61.400 zones, and if it provides a close above 62.500, it could continue to move toward the ranges of 64.690, 65.710, 67.790-67.980, and even 69.100. However, if the 55.840 zone fails to support the price, then it could decrease further toward the ranges of 54.635 and 52.020.
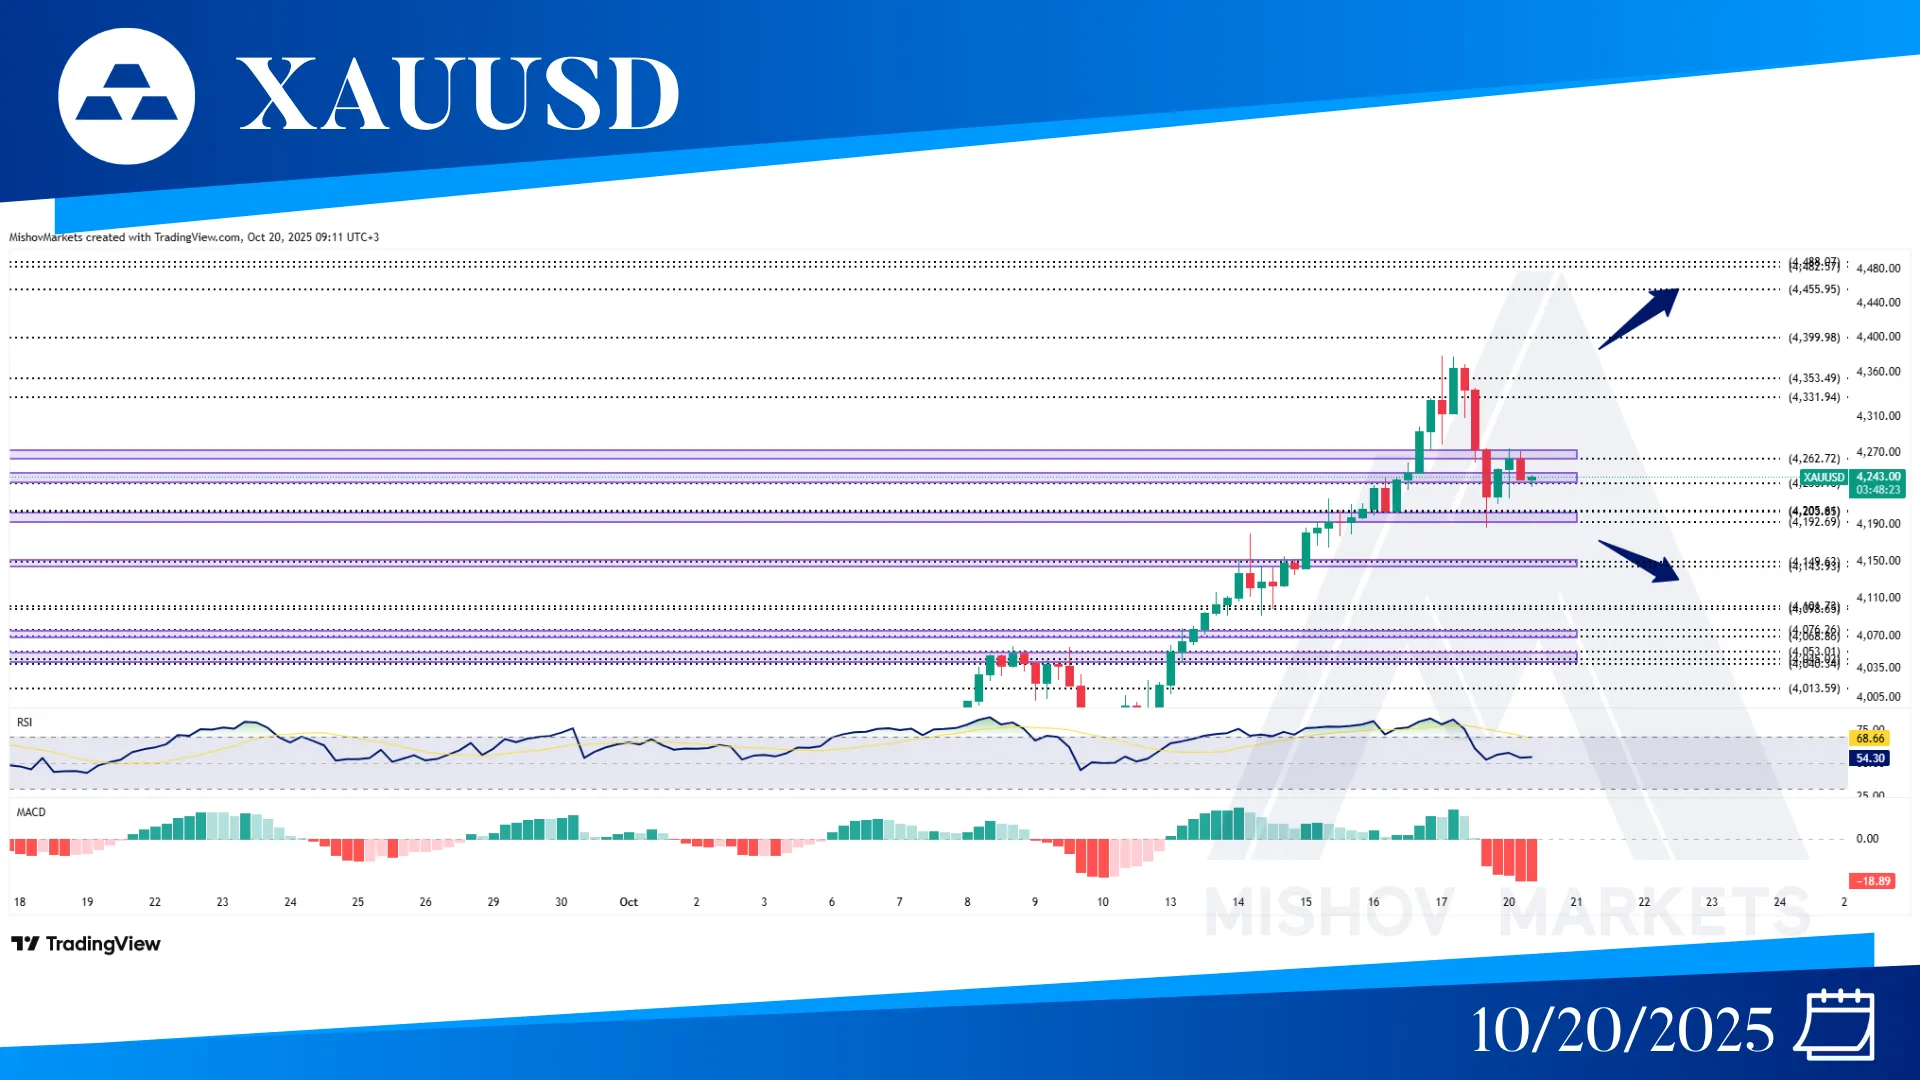
In XAUUSD, as precisely mentioned in Wednesday’s analysis, the price continued to increase and closed above 4205, subsequently moving toward our targets at the 4235-4246, 4262-4273, 4307, and 4353 zones; however, it then faced resistance and returned to the 4205-4192 zones. Now if the price receives support from the 4192 and continues to increase and provide a close above 4380, then it could continue to move toward the 4399, 4455, 4482-4488, and 4566 zones. But if the 4192-4205 zone fails to support the price, then it could start to retrace some of its movements toward 4149-4143, 4104-4098, 4076-4068, 4053, 4017-4013, 3984-3976, 3925, 3905-3898, and 3880-3888.
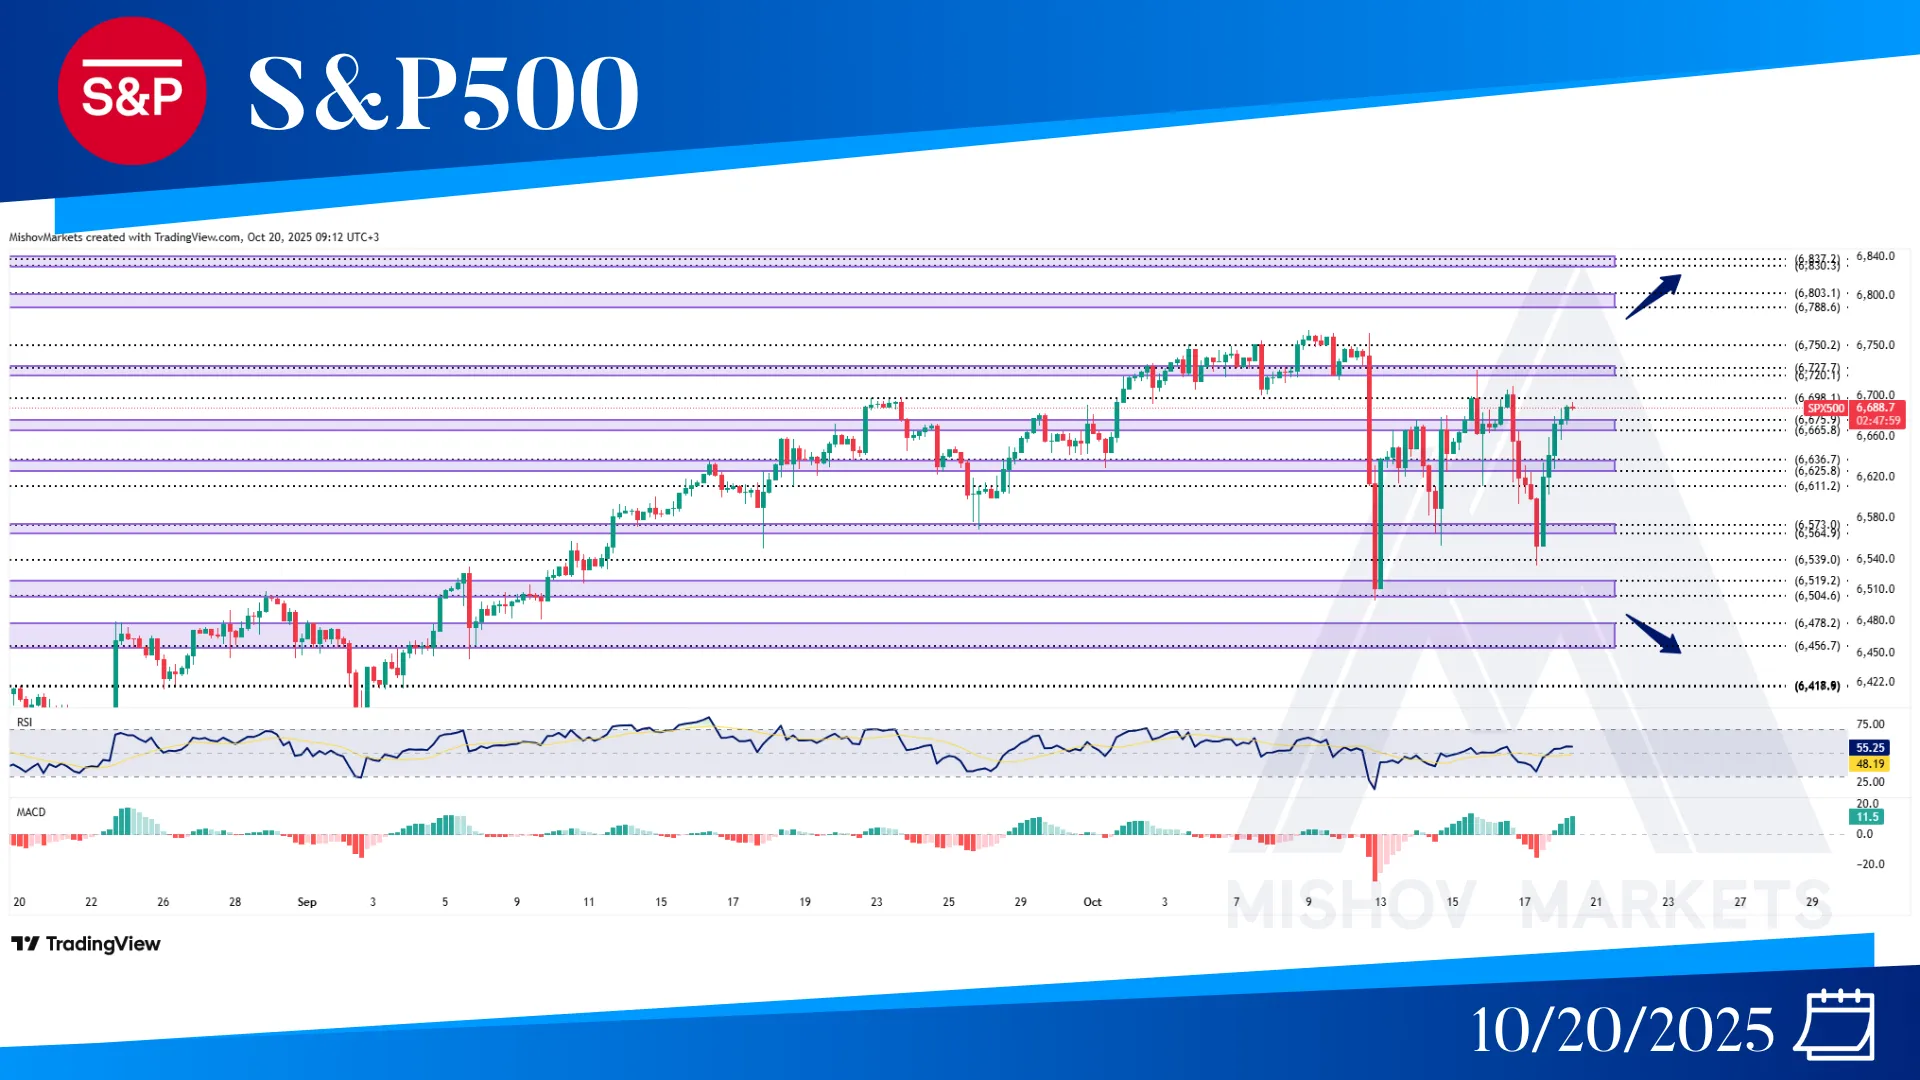
In the S&P 500, as precisely mentioned in Monday’s analysis, the price continued to increase and reached our targets at 6698 and 6720-6727 and faced resistance and decreased toward 6564 once more. Now if it breaks below the 6500 zone, then it could continue to decrease toward 6478-6456, 6418, and 6364-6361. But if it continues to increase, it could move to 6698 and 6720-6727, and if it breaks above the 6760 level, then it could continue to reach our next targets at the 6788-6803, 6830-6837, and 6880 zones.
