


Market Analysis 19 Jan 2026

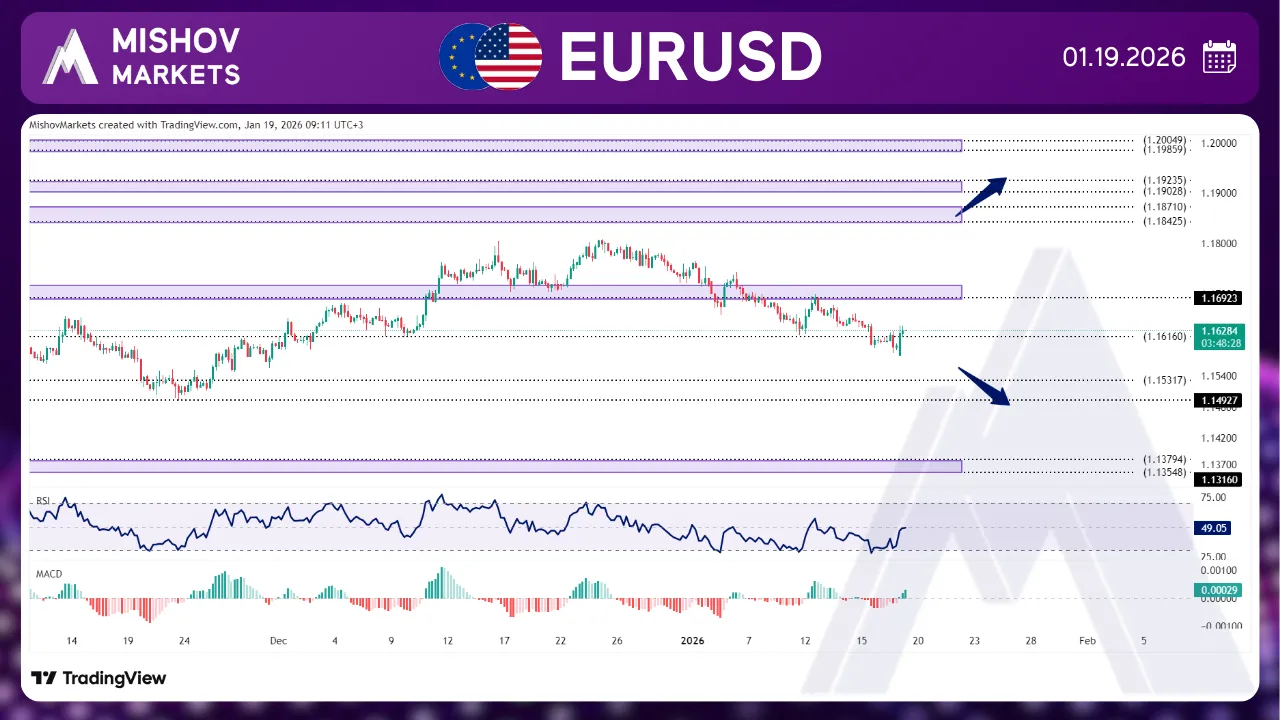
In EURUSD, as mentioned in Wednesday's analysis, after the price faced resistance at 1.16920, it has returned to the 1.16160 zone to seek support. Now if the price receives support at this level, it could reach our target of 1.16920 again; furthermore, if it continues to rise and closes above 1.18100, it may potentially reach our targets of 1.18420–1.18710, 1.19230, or even 1.20040. However, if the price fails to find support at this level and it provides a close below the 1.15750, then it could move toward the 1.15320 level to receive support; though, if this level fails to provide support, the price could decrease further to reach targets at the 1.14950, 1.13540–1.13750, and 1.13150–1.12890.
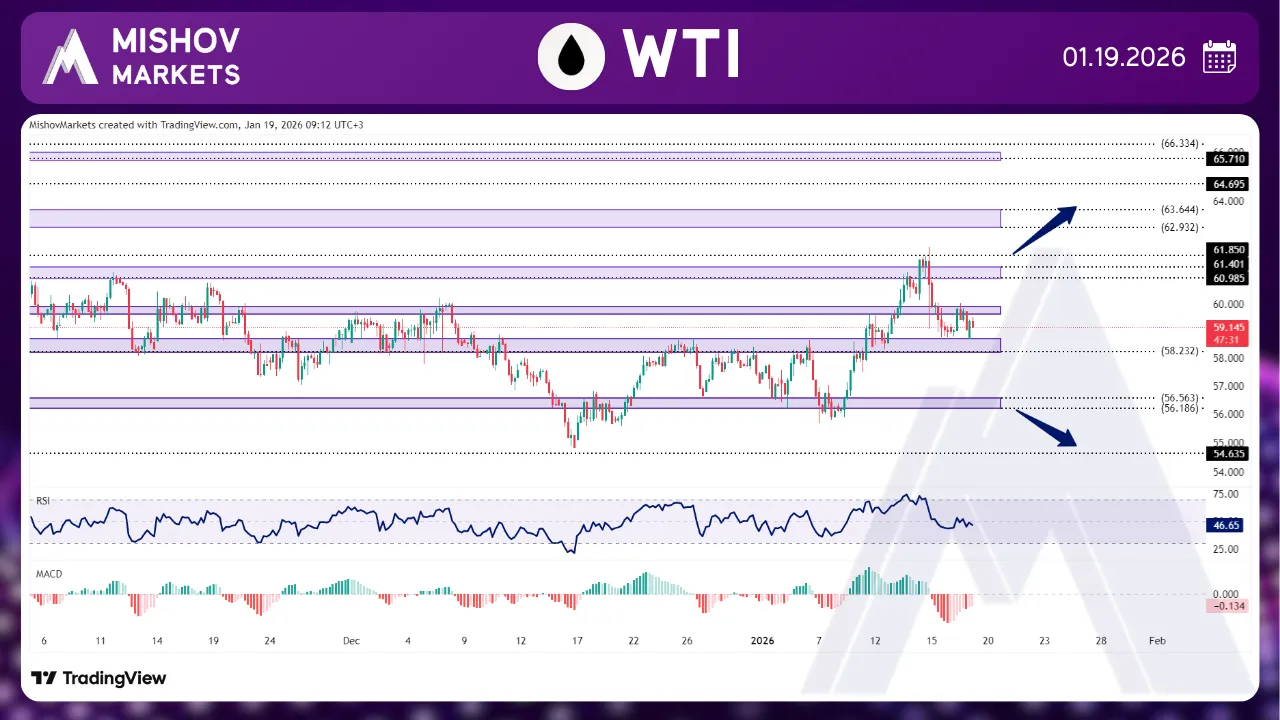
In WTI, as precisely mentioned in Wednesday's analysis, the price continued to increase and reached our next target at 61.850 and faced resistance. Then it started to retrace some of its bullish momentum and reached our targets at the 59.900–59.600 and 58.700–58.230 zones to seek support. Now if the price receives support, it could increase and reach our targets at the 60.980-61.400 zone and 61.850; additionally, if it closes above 62.500, it may continue to move toward the ranges of 62.900-63.550, 64.690, 65.710, 67.790-67.980, and even 69.100. However, if the 58.700-58.230 zone fails to support the price, and it provides a close below 57.400, then it could decline further towards the levels of 56.570-56.180, 54.630, 52.020, and 49.880.
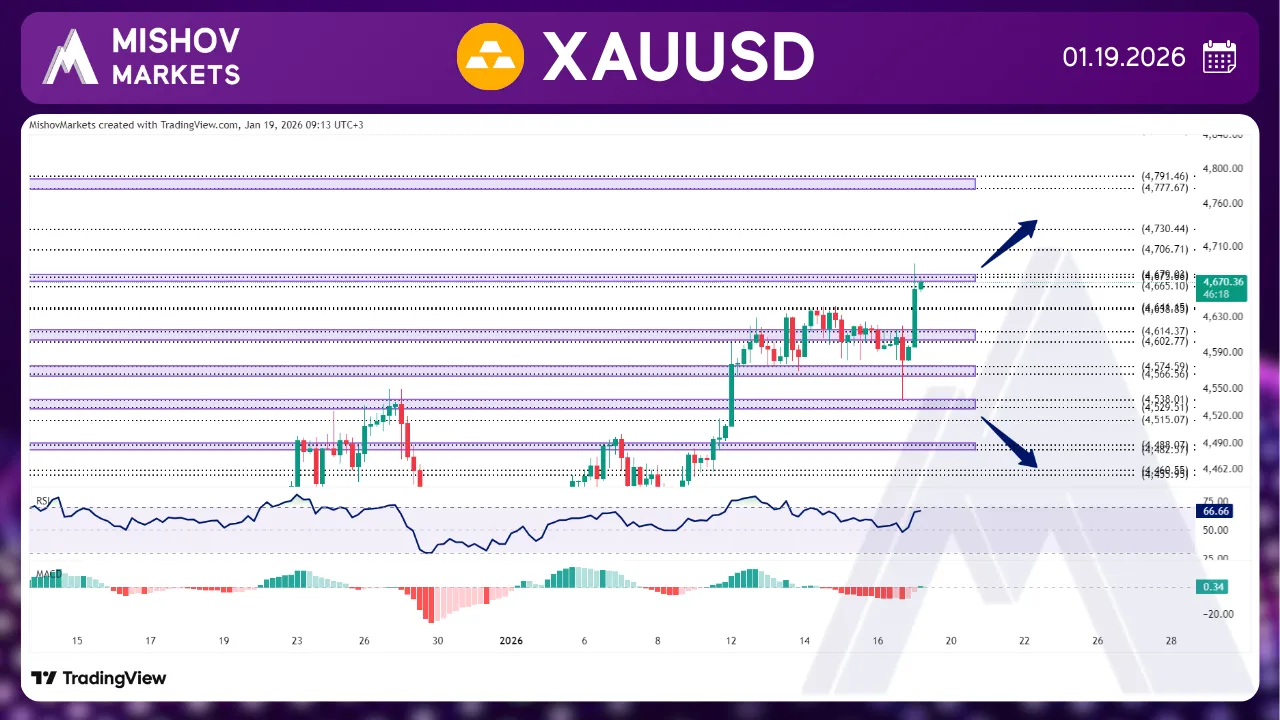
In XAUUSD, as precisely mentioned in Wednesday’s analysis. The price faced resistance at the 4641-4638 zone and started to move toward our targets at 4614-4606, 4574-4566, and 4538-4529, and after receiving support from this zone, it started to increase and reached our targets at the 4665 and 4675-4679 zones. Now if the price continues to increase and breaks above the 4675-4679 level with a close above 4691, it could continue to increase and reach our next targets at 4706, 4730, and 4777-4791. However, the price might face resistance at the 4679-4675 or 4706 zones and start to retrace some of its bullish momentum toward 4641-4638, 4614-4606, and 4574-4566, and if it fails to receive support from these zones, then it could decrease further toward 4538-4529, 4515, 4488-4482, 4460-4455, and 4410 for support.
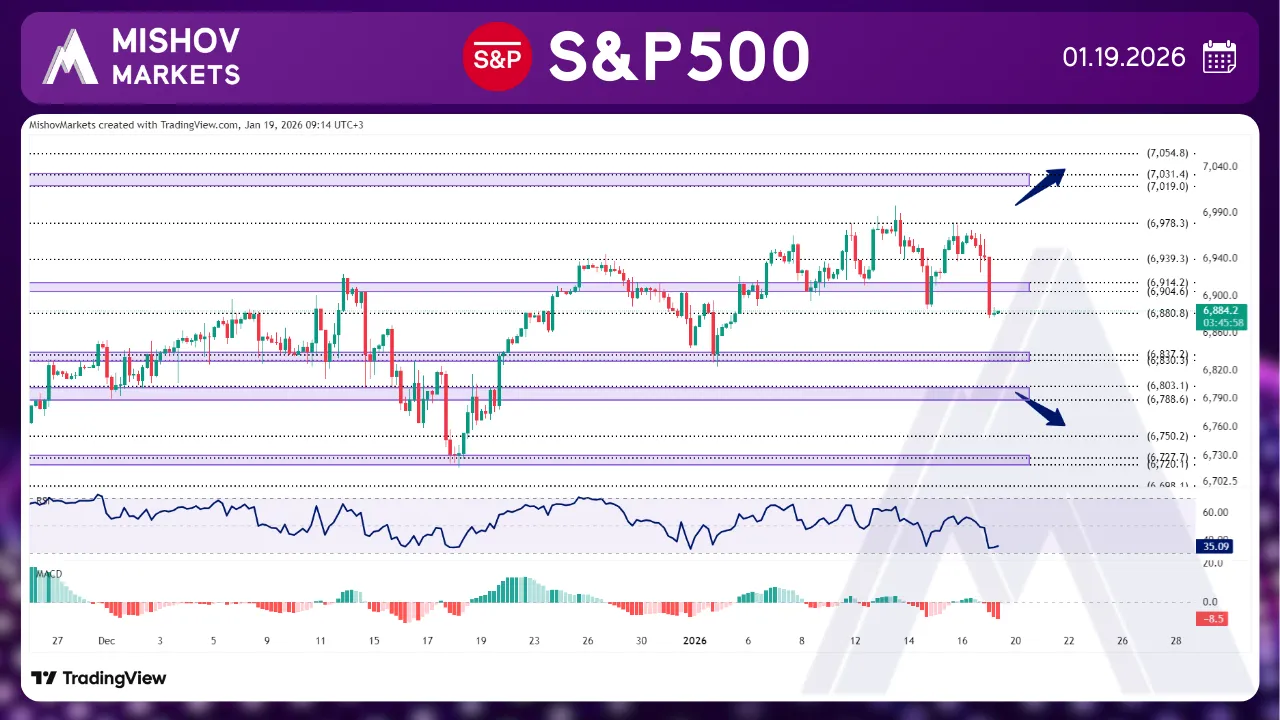
In the S&P 500, as precisely mentioned in Wednesday’s analysis, the price faced resistance at the 6978 zone once more and it reached our target at 6914-6904 and 6880 once more. Now if the price receives support from this zone and continues its bullish momentum and breaks above the 6978 level with a close above 6999, it could reach our next targets at the 7019-7031, 7054, and 7118-7141 zones. However, if the price fails to receive support, and it provides a close below 6870, it could start to retrace some of its movement toward the 6837-6830, 6803-6788, 6750, 6727-6720, 6698, and 6675-6665 zones to seek support.
