


Market Analysis 18 Feb 2026

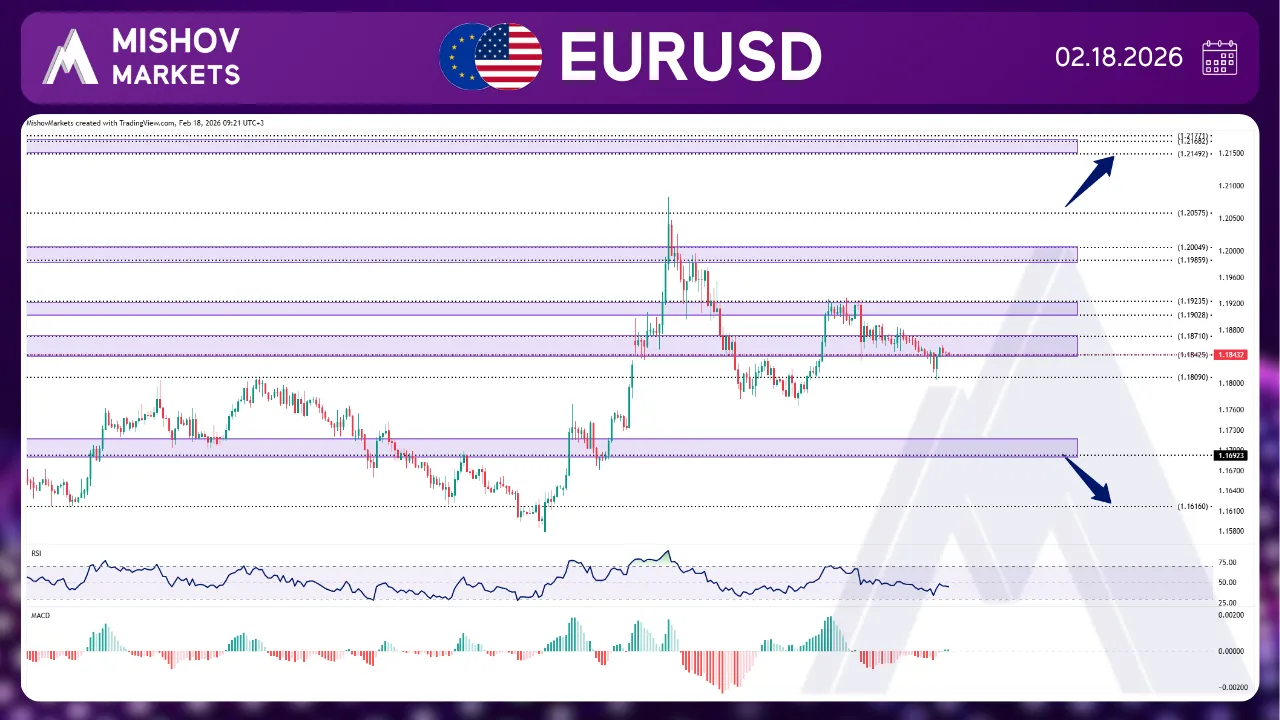
In EURUSD, as mentioned in Monday’s analysis, the 1.18710–1.18400 zone did not hold as support, triggering a decline toward our 1.18100 target. If price now finds support in this area and resumes its upward move, a break above the 1.19020–1.19230 range could open the way for further gains toward 1.19850–1.20040 and 1.20575. Moreover, a daily close above 1.20850 may extend the rally toward 1.21490–1.21770 and 1.23140. On the downside, failure of the 1.18100 level to provide support could lead to a drop toward 1.17200. If the price breaks below this level and 1.16160 also fails to hold, further downside pressure may push the pair toward 1.15320 and potentially lower to 1.14950, 1.13540–1.13750, and 1.13150–1.12890.
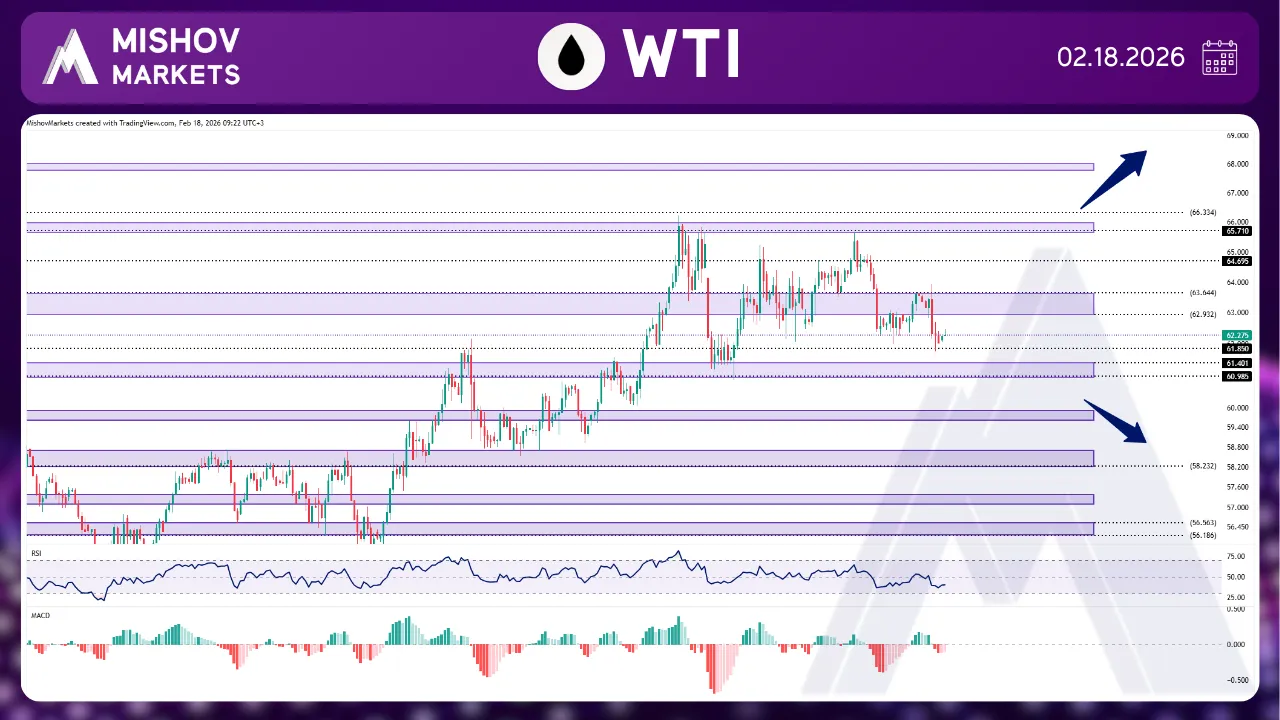
In WTI, As mentioned in Monday’s analysis, the 63.640 zone acted as resistance and pushed the price toward our target at 61.850. Now, if the price receives support from 61.850 and breaks the 62.900–63.400 zone with a close above 63.950, it could move higher toward our target at 65.710–65.980. Additionally, if it closes above 66.250, the price may continue to rise toward 67.790–67.980, 69.100, and 70.640–70.860. However, if the 61.850 or the 61.400–60.980 zone fails to act as support, the price could decline further toward 59.930–59.600 to seek support. Furthermore, if it breaks the 58.700–58.230 zone and provides a close below 57.400, it may continue to fall toward 56.570–56.180, 54.630, 52.020, and 49.880.
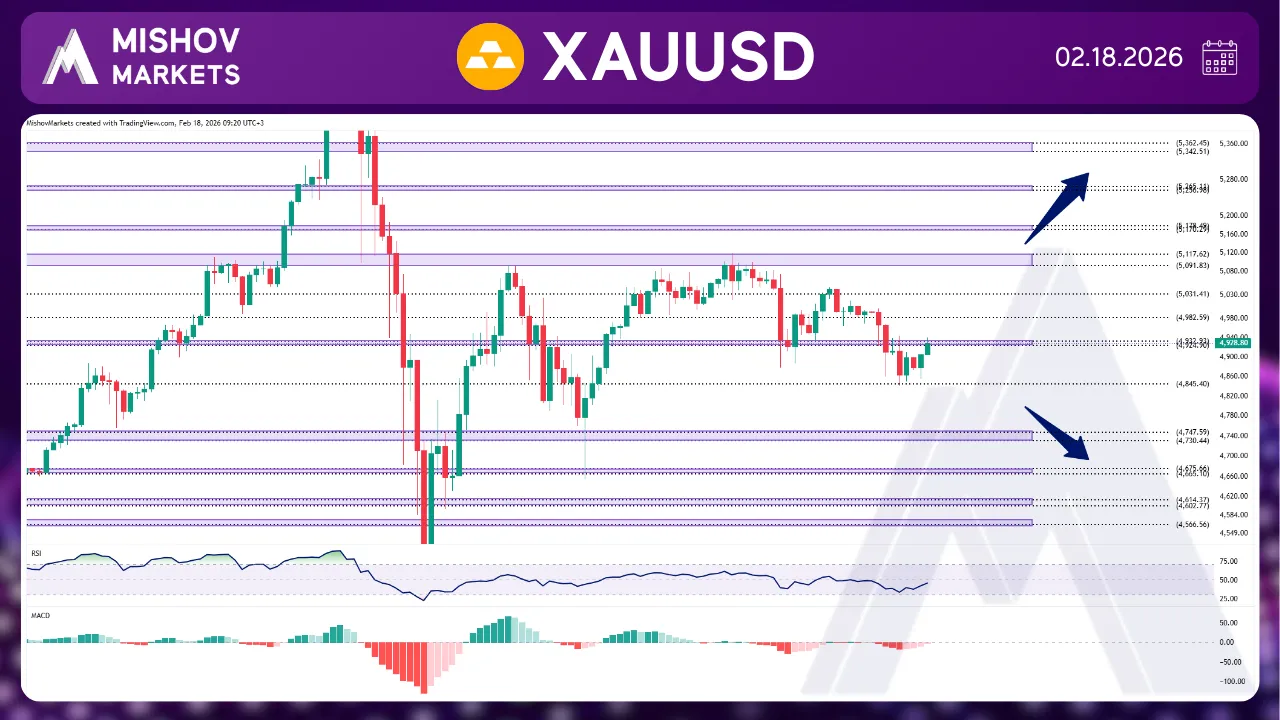
In XAUUSD, As precisely mentioned in Monday’s analysis, the price faced resistance at the 5031 zone, leading to a corrective move toward our targets at the 4982, 4933–4924, 4883, and 4845 levels. At this point, if the price receives support from 4845 and breaks above the 4924-4932 zone, it could continue to increase and reach our targets at 4982 and 5031. Also, if it breaks above the 5031 zone with a confirmed close above 5047, it may advance toward our next bullish targets at 5091–5117, 5170–5178, 5256–5265, 5342–5362, 5429, 5468, and 5567. Conversely, if the price faces resistance around the 4924-4932 or the 4983 zones, it could reverse lower once again, heading toward the support zones at 4747-4730, 4675-4665, 4614-4602, 4574-4566, and 4488-4482.
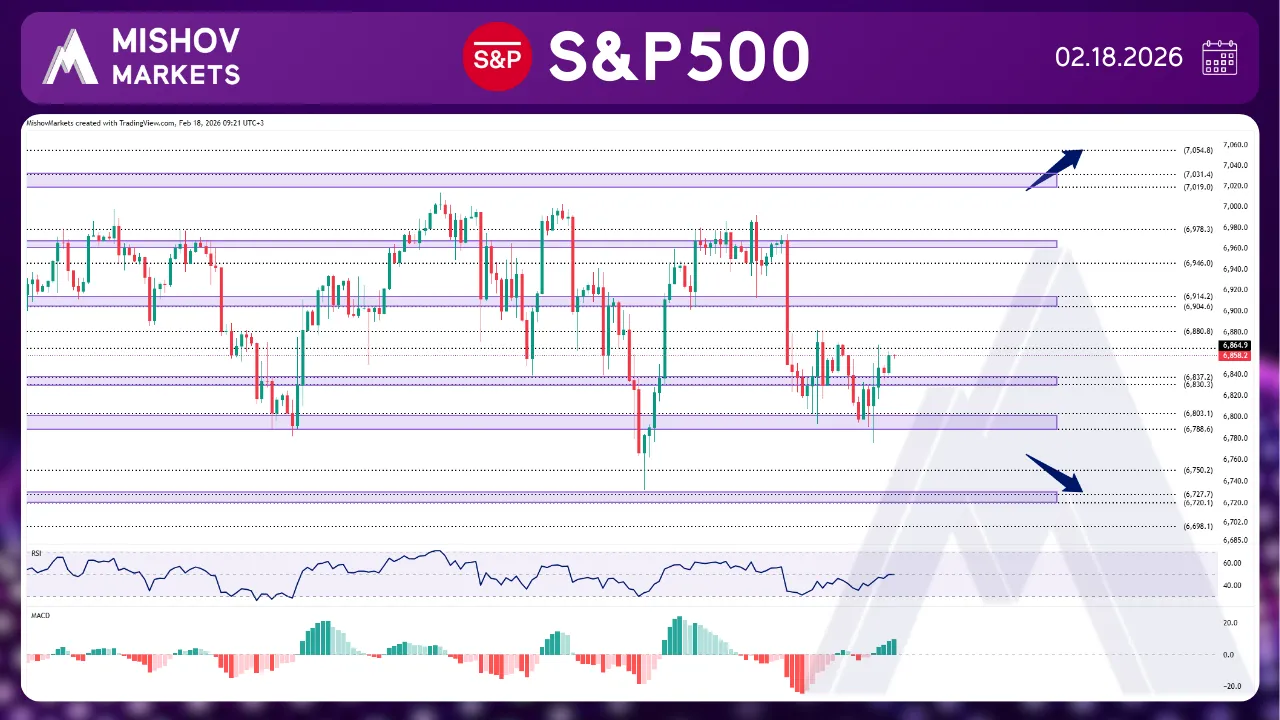
In the S&P 500, As precisely mentioned in Monday’s analysis, the price received support from the 6803-6788 zone and has reached our targets at 6830-6837 and 6864. At this point, if the price breaks above the 6880 zone, it may advance toward the 6904–6914, 6946, and 6978 levels again. Furthermore, a confirmed breakout above 6978, followed by a close above 6995, could potentially lead to new all-time highs at 7019–7031, 7054, and 7118–7141. Conversely, if the 6803–6788 zones fail to hold as support, the price could decline toward 6785. A further break below the 6727–6720 area may lead to deeper losses toward 6698, 6675–6665, 6636–6625, 6611, and 6573–6564.
