


Market Analysis 17 Sep 2025

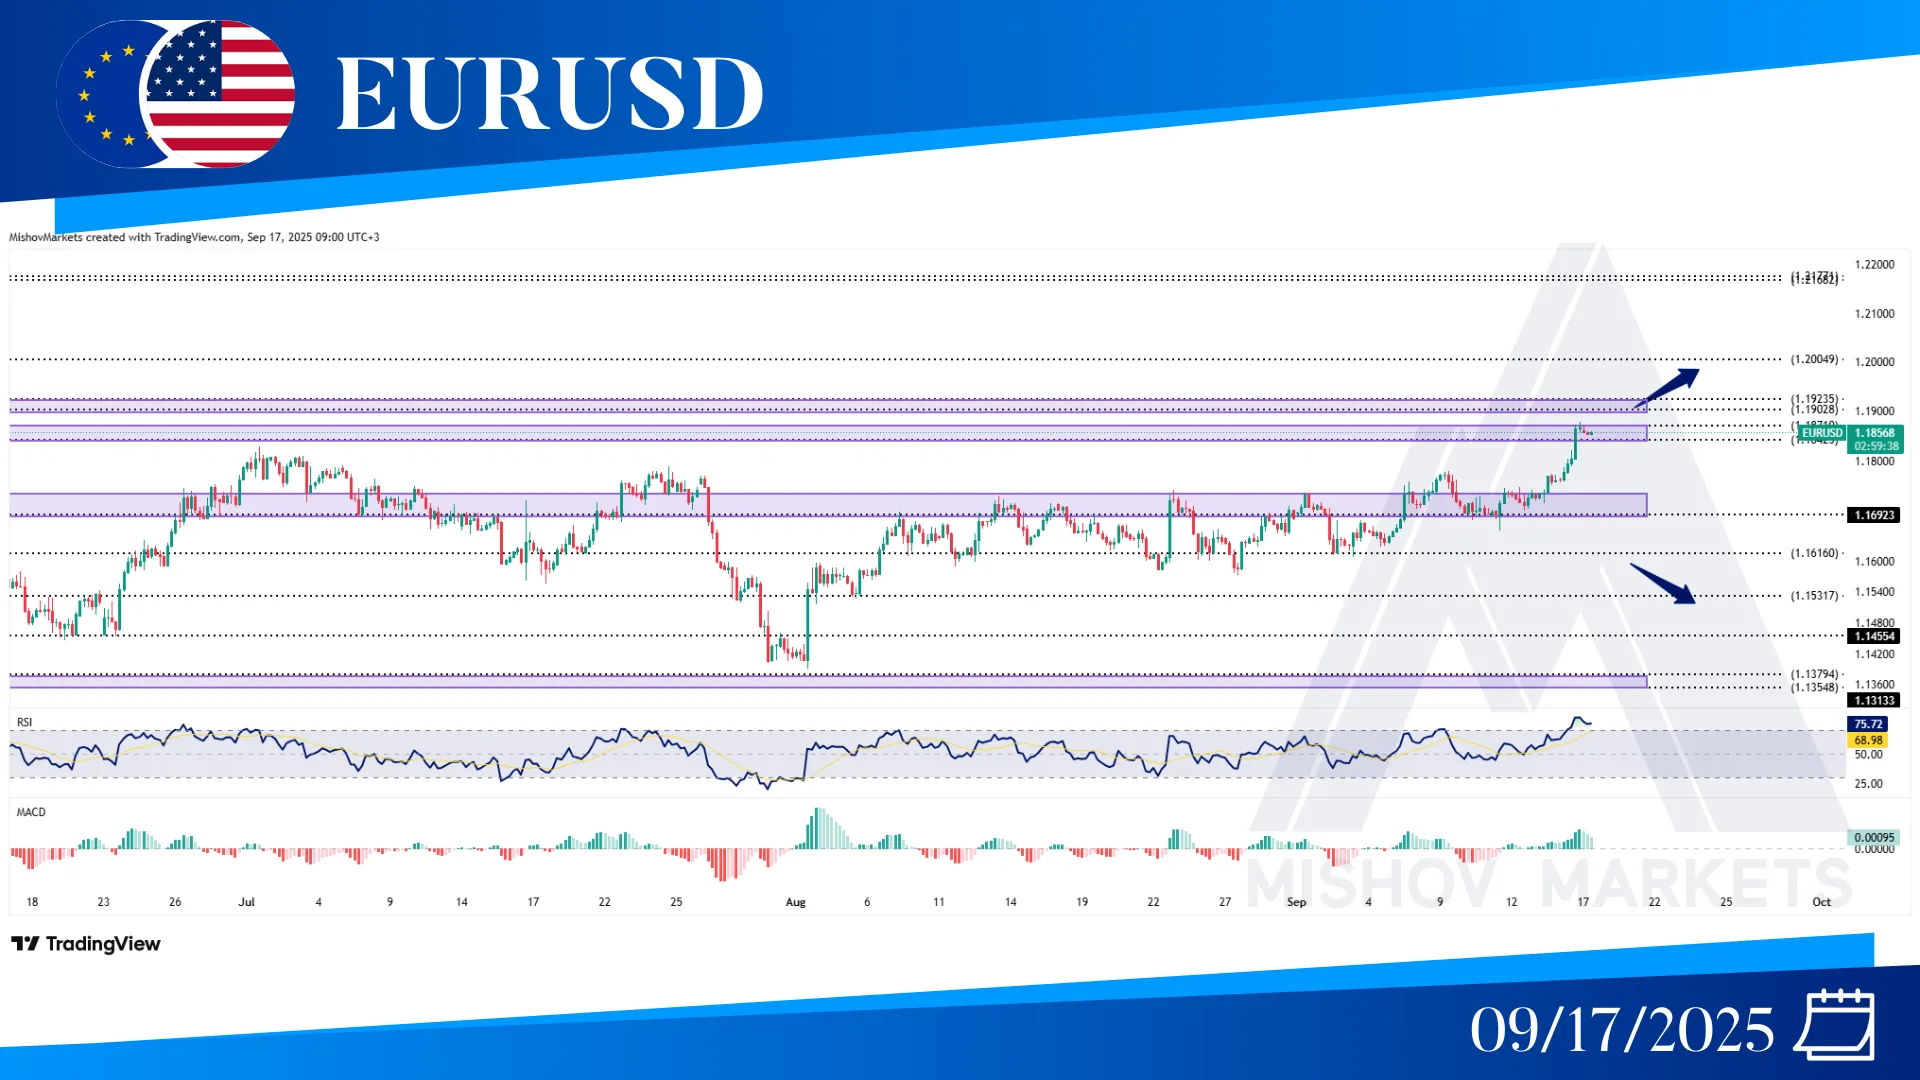
In EURUSD, as precisely mentioned in Wednesday’s analysis, the price received support at 1.16930 and eventually broke above 1.17500, reaching our target range of 1.18420 to 1.18710. Now it may face resistance at 1.18710 and come back to test the 1.17500-1.17000 zone to receive support from it, then it could continue to increase and reach our next targets at 1.18420-1.18710, 1.19230, or possibly 1.20040. However, it might come back to the aforementioned trading range (1.16160-1.17400), but if it falls below 1.16550, it could decrease to 1.15310, and then if this Level fails to support the price, it could decrease further toward our targets at the 1.14550 and 1.13540-1.13750 zones.
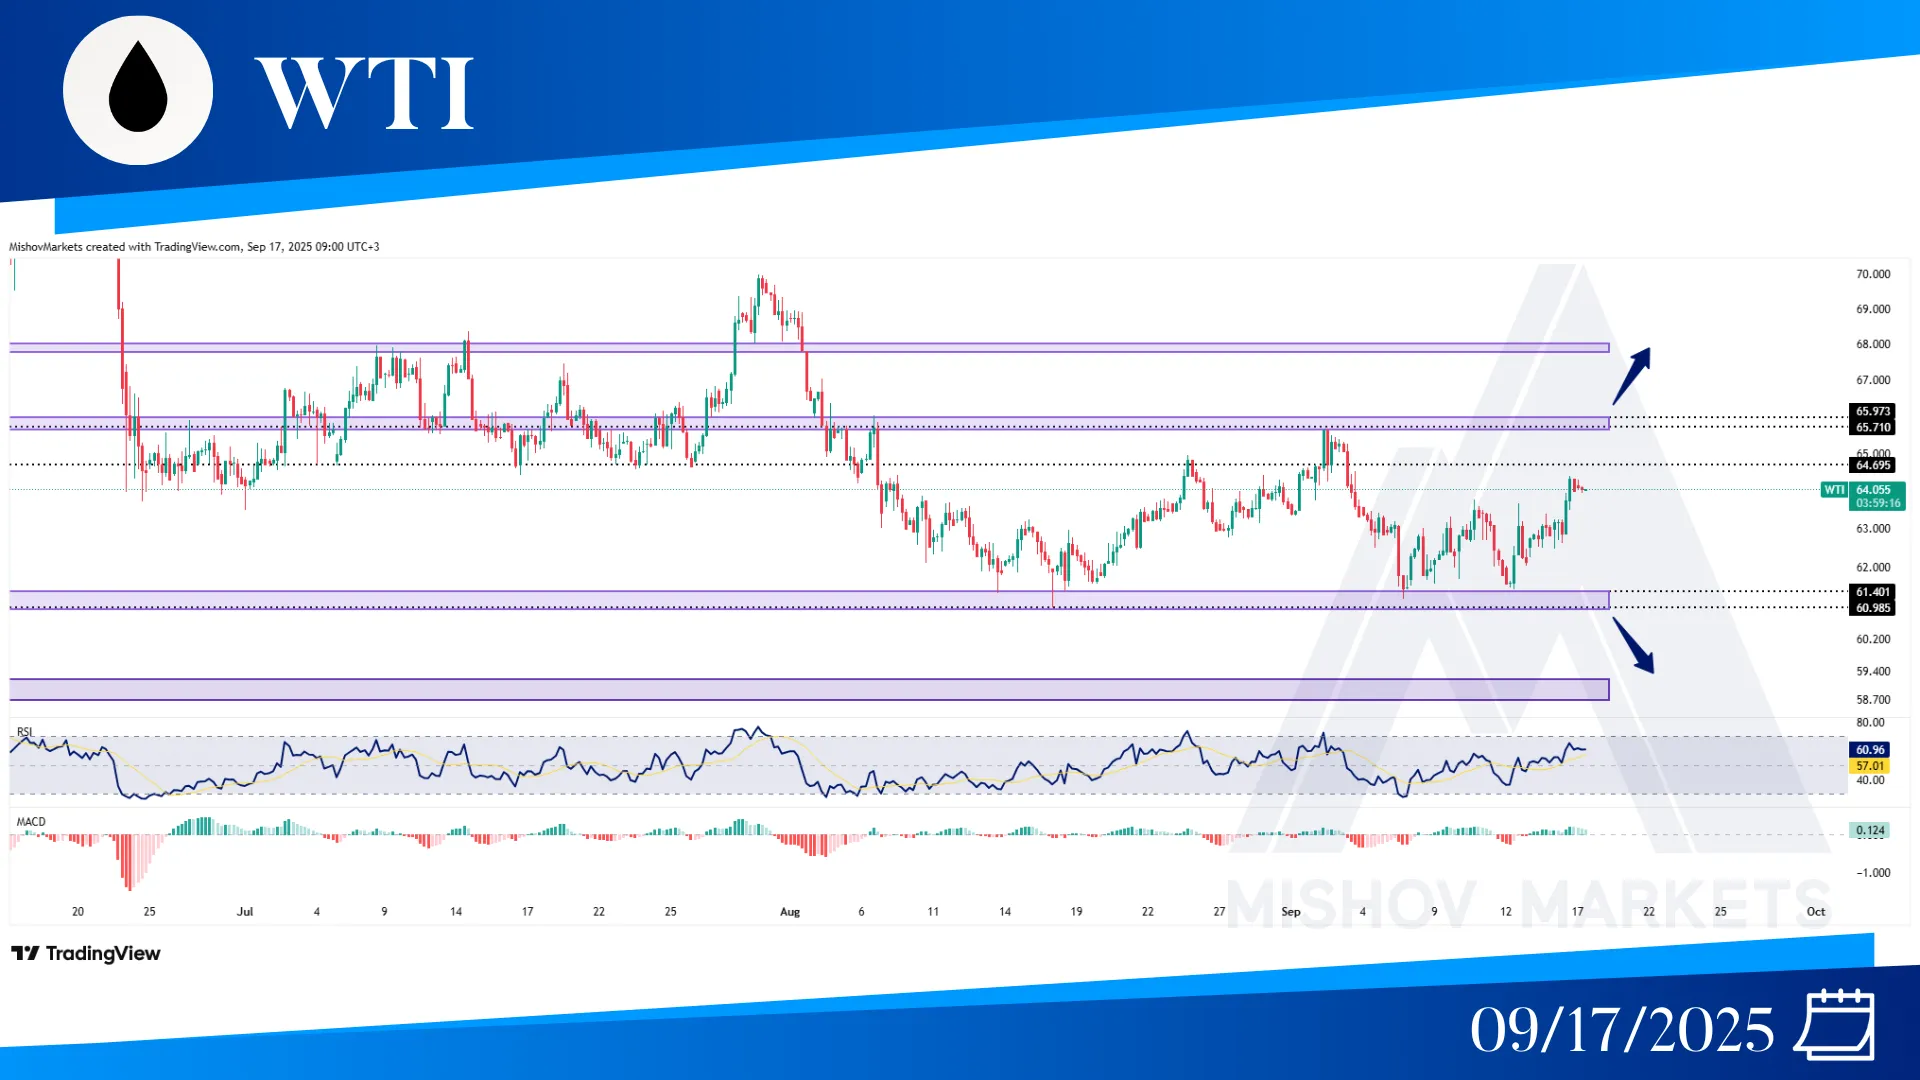
In WTI, as precisely mentioned in Monday's analysis, the 61.400 level acted as support and pushed the price toward our target at 64.690. Now the price could continue to increase and reach our targets at 64.690 and 65.700-65.970; additionally, if it breaks above the 65.710 level and closes above 66.100, it may continue to increase toward the ranges of 67.790-67.980 and 69.100. But it might face resistance and come back to test the 61.400-60.990, and if it fails to support the price, then it could decrease further toward the ranges of 59.200-58.840 and 57.800-58.100.
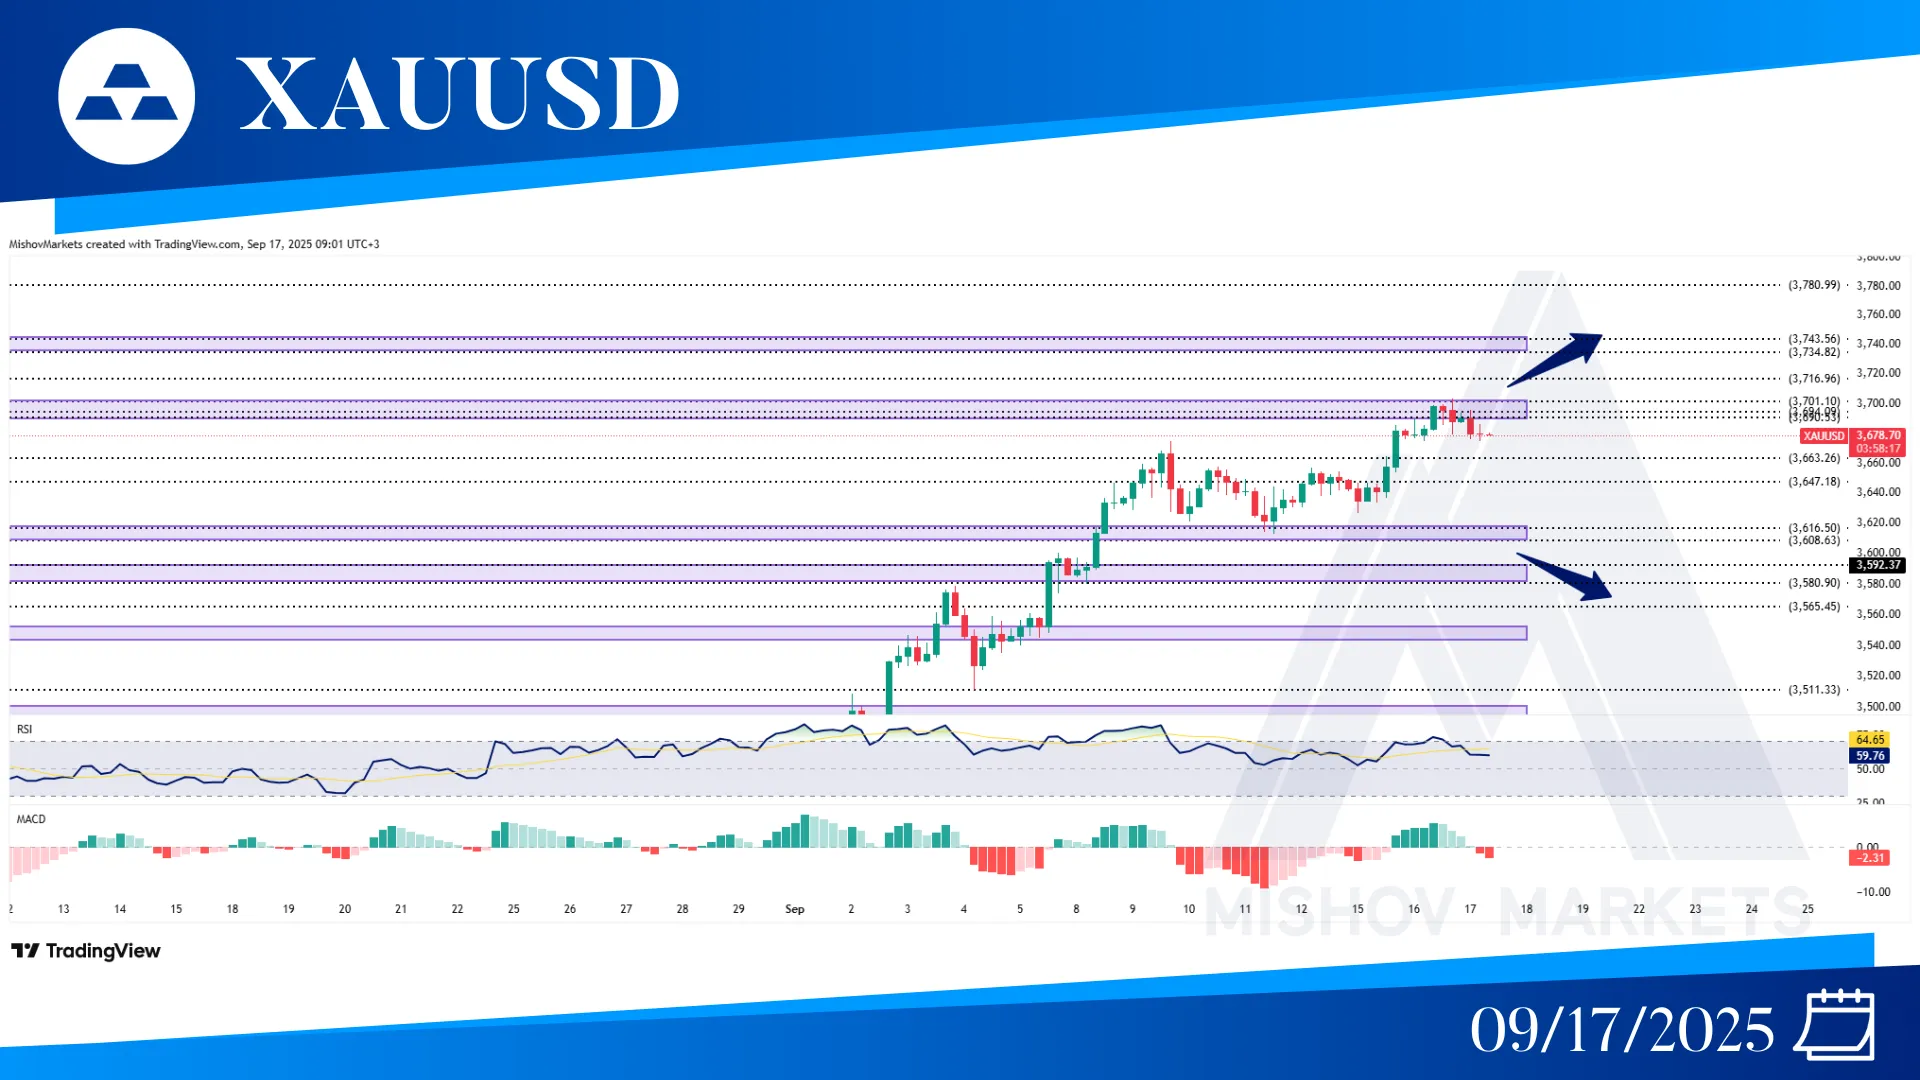
In XAUUSD, as precisely mentioned in Monday’s analysis, the price continued to increase and provided a close above 3675, then it reached our targets at 3690-3694 and 3701. Now if the price faces a resistance at 3701, then it could come back to test the 3663, 3647, and 3616-3608 to receive support from them, and then if it continues to increase and provide a close above the 3704, then it could continue to move toward 3716, 3734-3743, 3780, and 3827. But if the 3616-3608 zone fails to support the price, then it could start to retrace some of its movements toward 3592-3580, 3565, 3552-3546, 3511, 3501-3490, and 3483 to receive support. At this point if the 3461 fails to support the price, then it could decrease further toward the 3448, 3429, 3409-3400, and 3391-3387 zones.
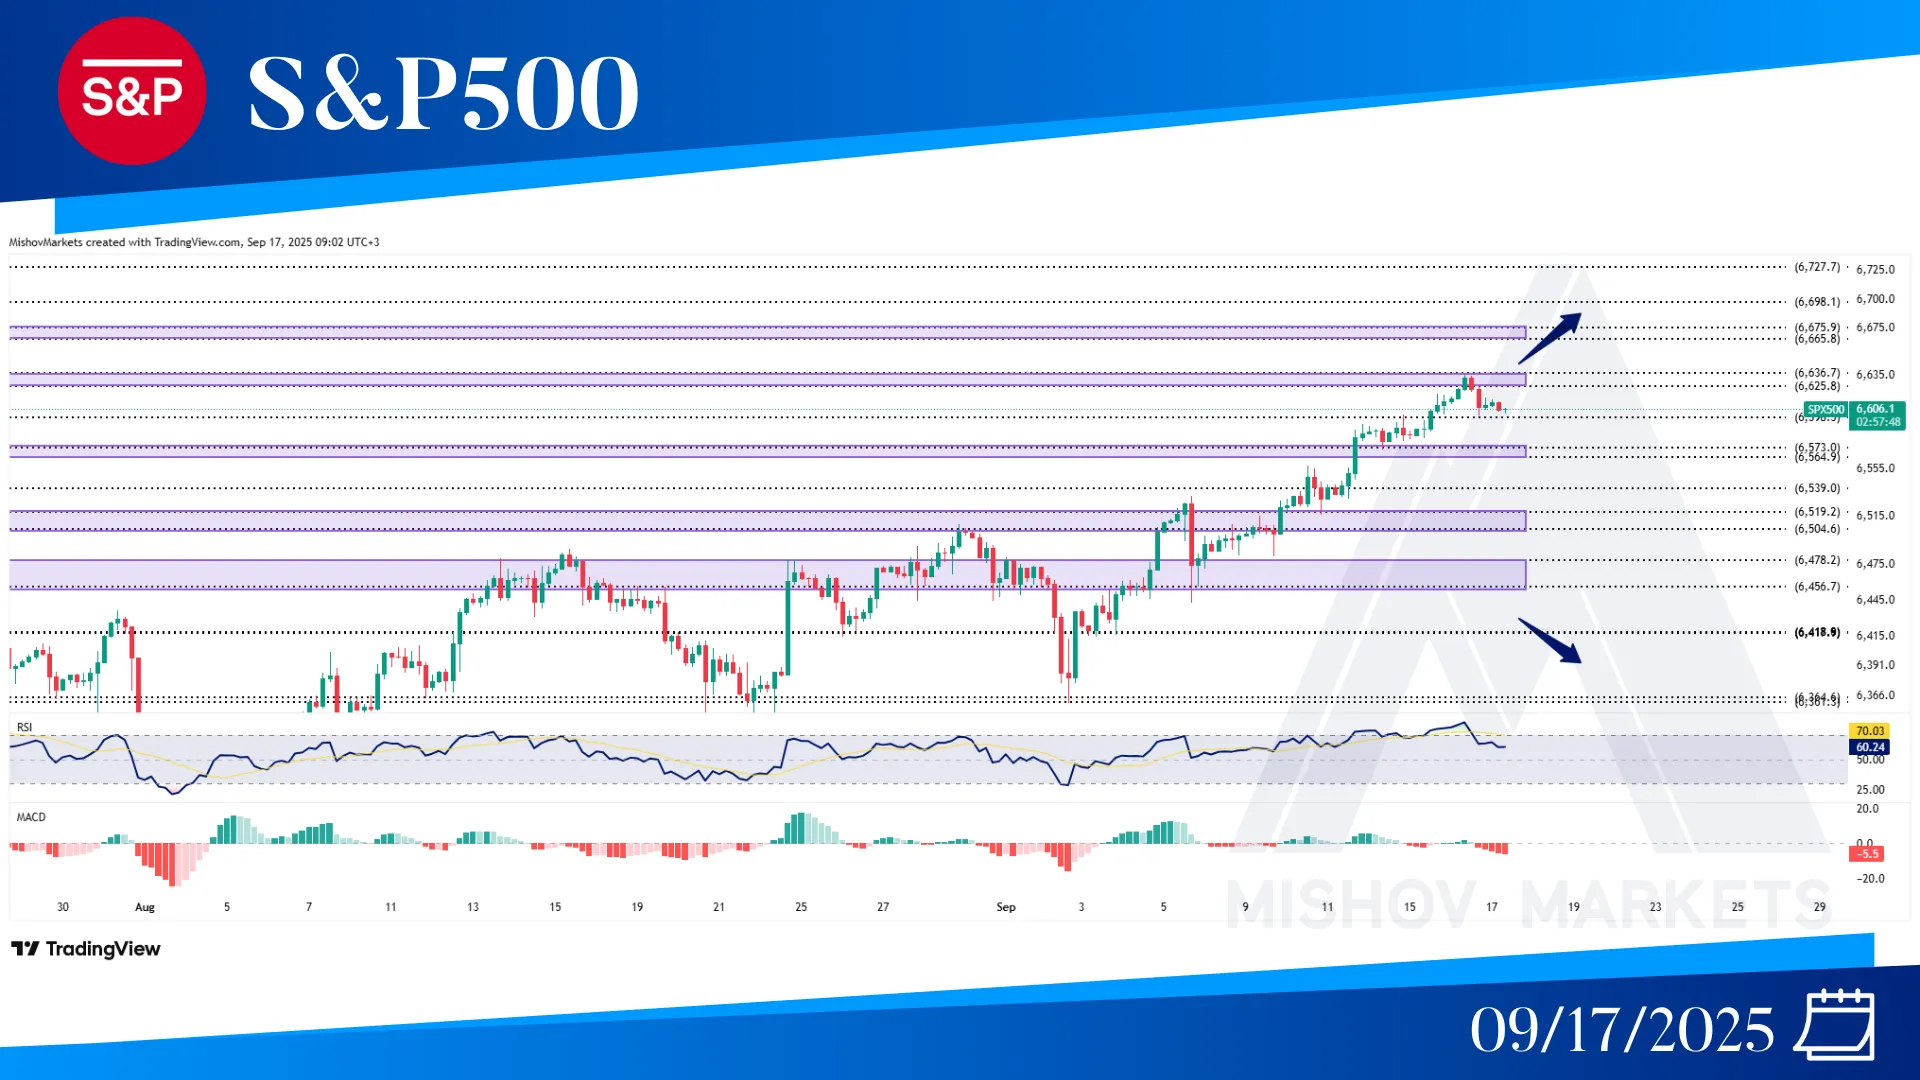
In the S&P 500, as precisely mentioned in Monday’s analysis, the 6573 level acted as support and pushed the price toward our target at 6625-6636. Now if the 6625-6636 zone acts as resistance, it could decrease and reach our targets at 6598, 6573-6564, 6539, and 6519-6504. If any of these zones acts as support or the straight break above 6638, then it could increase toward 6665-6675, 6698, and 6727. But if this zone fails to support the price, then it decreases further toward our target at 6478-6456 and 6418 to receive support, but if these zones also fail to do so, then it could decrease further toward 6361-6364, 6335-6326, and 6300.
