


Market Analysis 17 Dec 2025

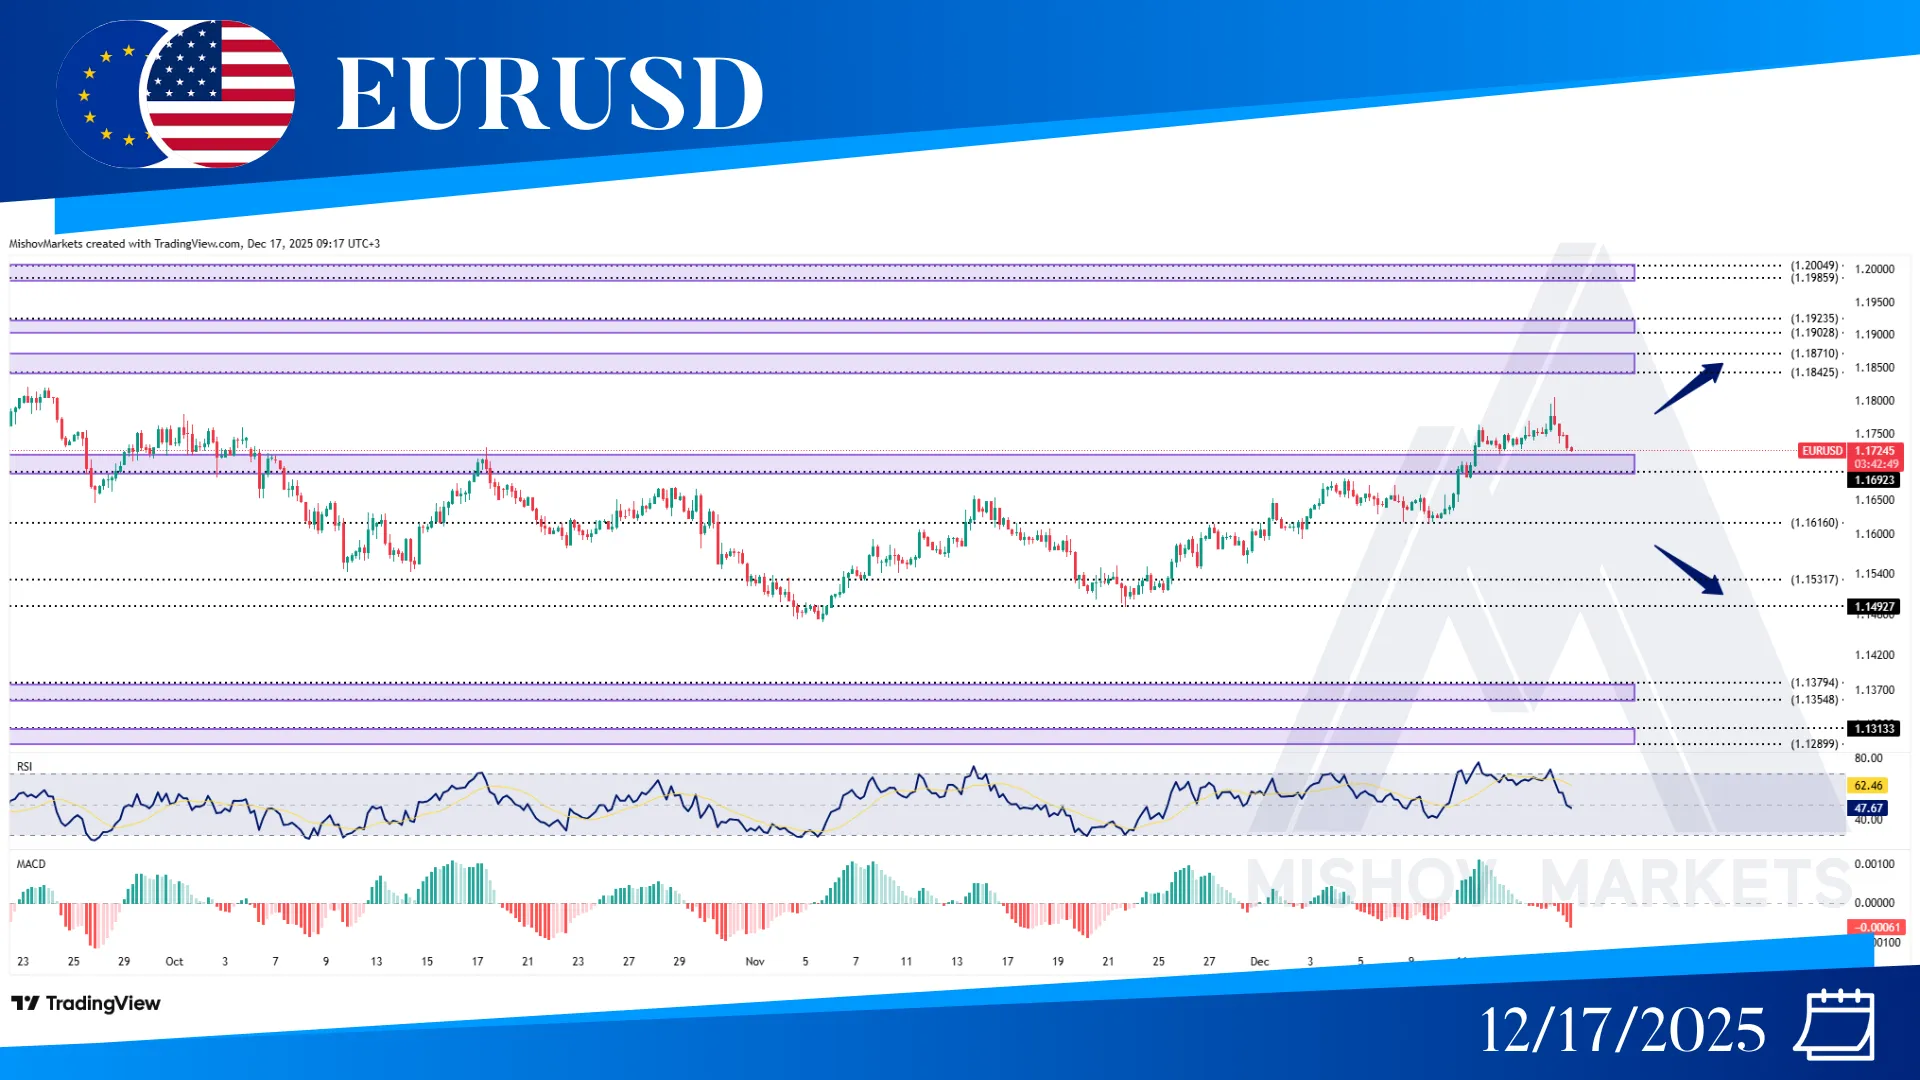
In EURUSD, as mentioned in Monday's analysis, the price failed to provide a close above the 1.17790 and has returned to test the 1.16920-1.17150 zone. Now if this zone supports the price and it continues to increase with a close above 1.18050, it could continue to reach our targets at 1.18420–1.18710, 1.19230, or possibly 1.20040. However, if the 1.16920 level fails to support the price, along with the 1.16160 level also failing to support it, the price could decrease further to reach targets at the 1.14950, 1.13540–1.13750, and 1.13150–1.12890 zones.
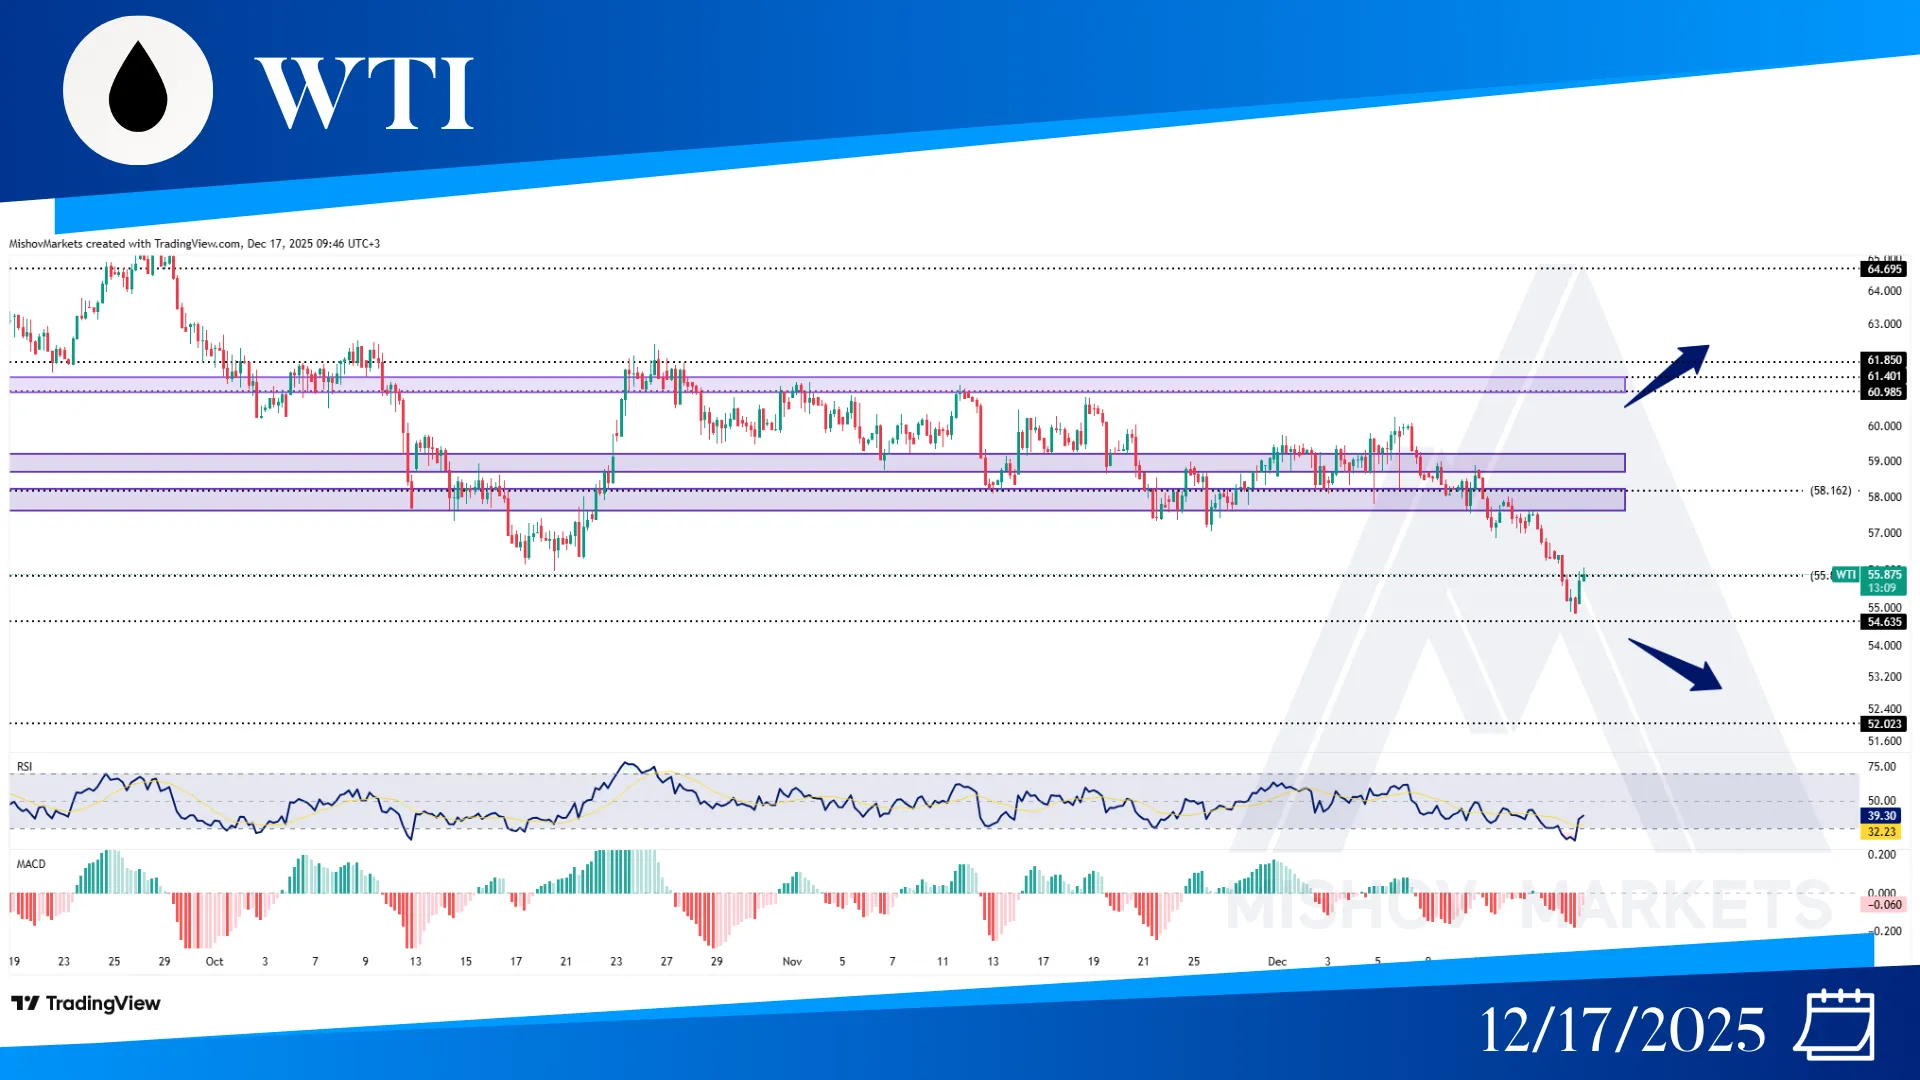
In WTI, as precisely mentioned in Monday's analysis, the price provided a close below the 56.800 level and reached our target at 55.840. Now if the price receives support from this zone and starts to increase, it could reach our targets at 57.660–58.150, 58.700–59.200, 60.980, and 61.850. If it provides a close above 62.500, then it might continue to move toward the ranges of 64.690, 65.710, 67.790-67.980, and even 69.100. But if the price provides a close below the 54.850 level, then it could decrease further toward the ranges of 54.630, 52.020 and 49.880.
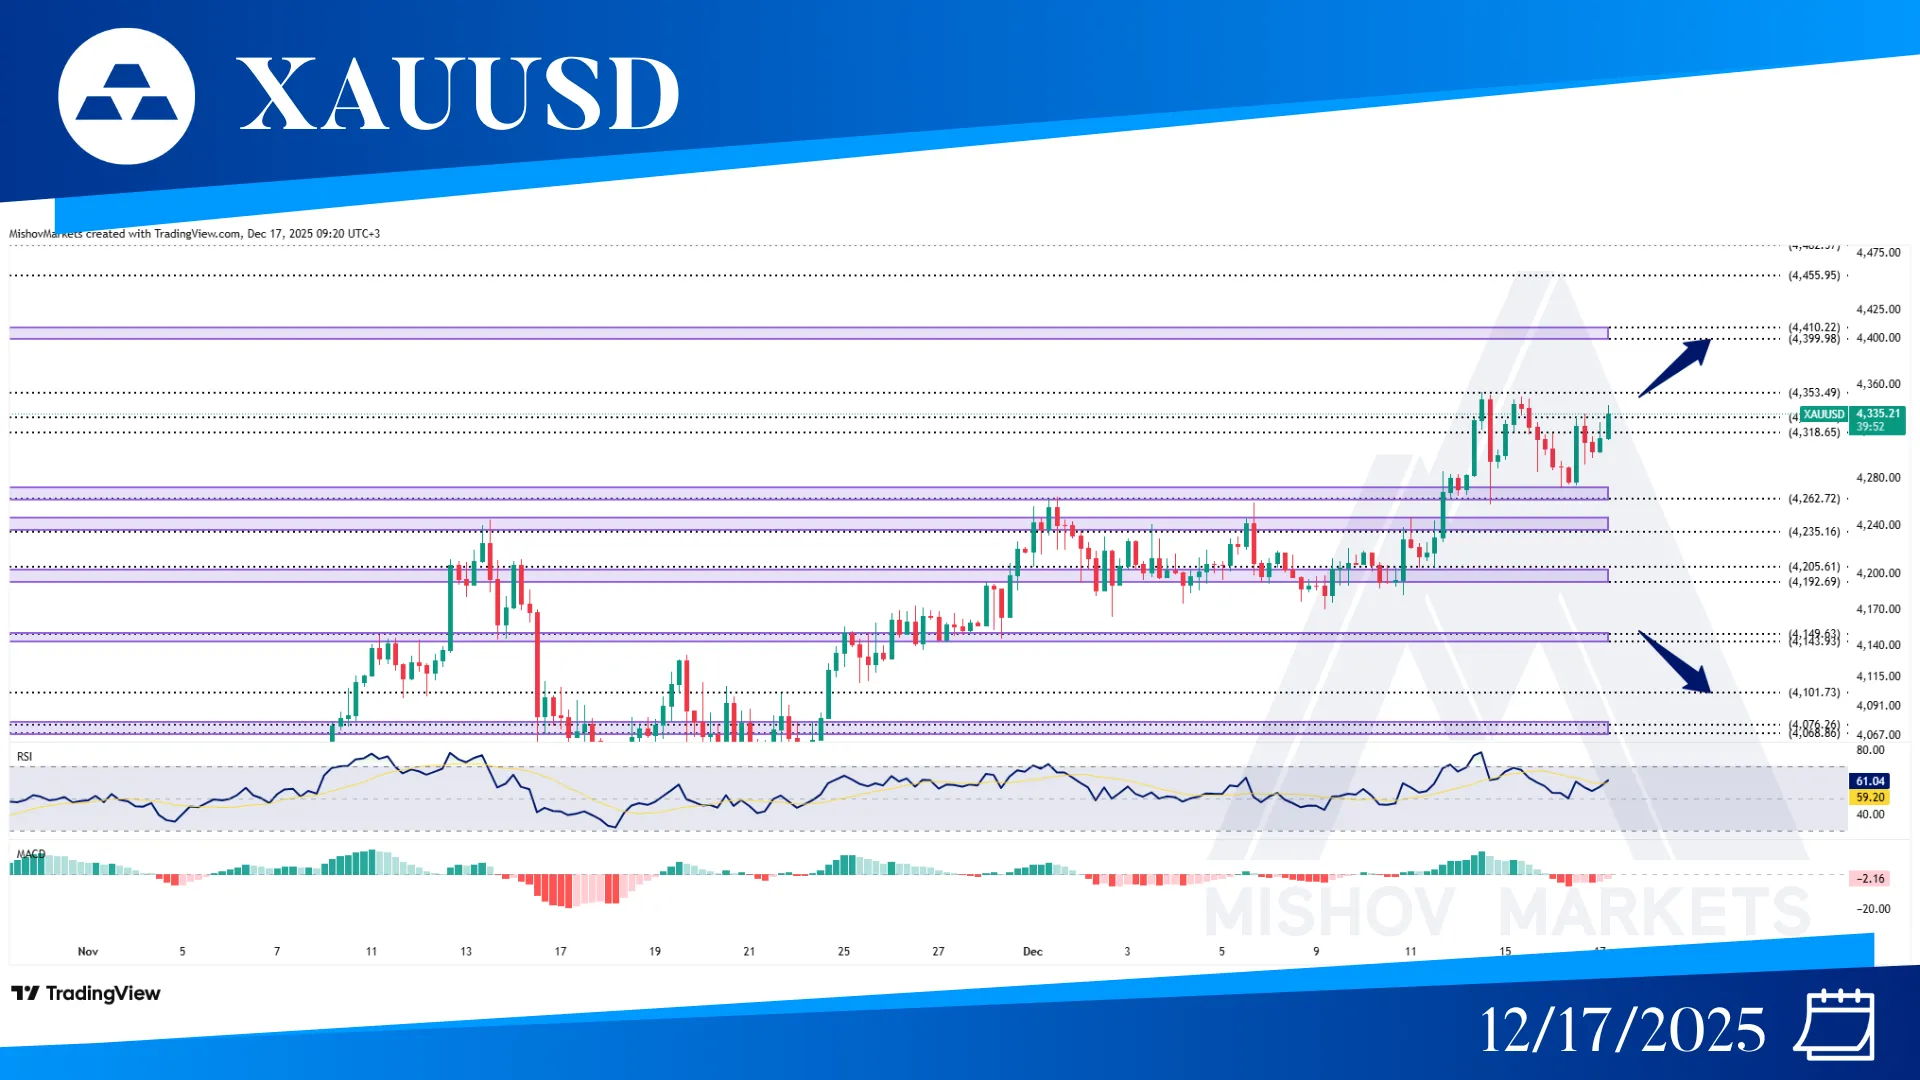
In XAUUSD, as mentioned in Monday’s analysis. After hitting resistance at 4353, the price retraced to our 4262–4272 target zone. Finding support there, the market is now consolidating within a range between 4353 and 4262. Now if the price continues to increase and breaks the 4353 level with a close above 4385, it could start to increase toward a new all-time high of 4399-4410 and 4455. But if the 4353-4373 zone acts as resistance and the price breaks below the 4262 level with a close below the 4255, then it could decrease toward 4235, 4205-4192, and 4149-4143 for support. And if it also breaks below these zones, then it could move toward our next targets at 4101, 4076-4068, 4053-4040, and 4013.
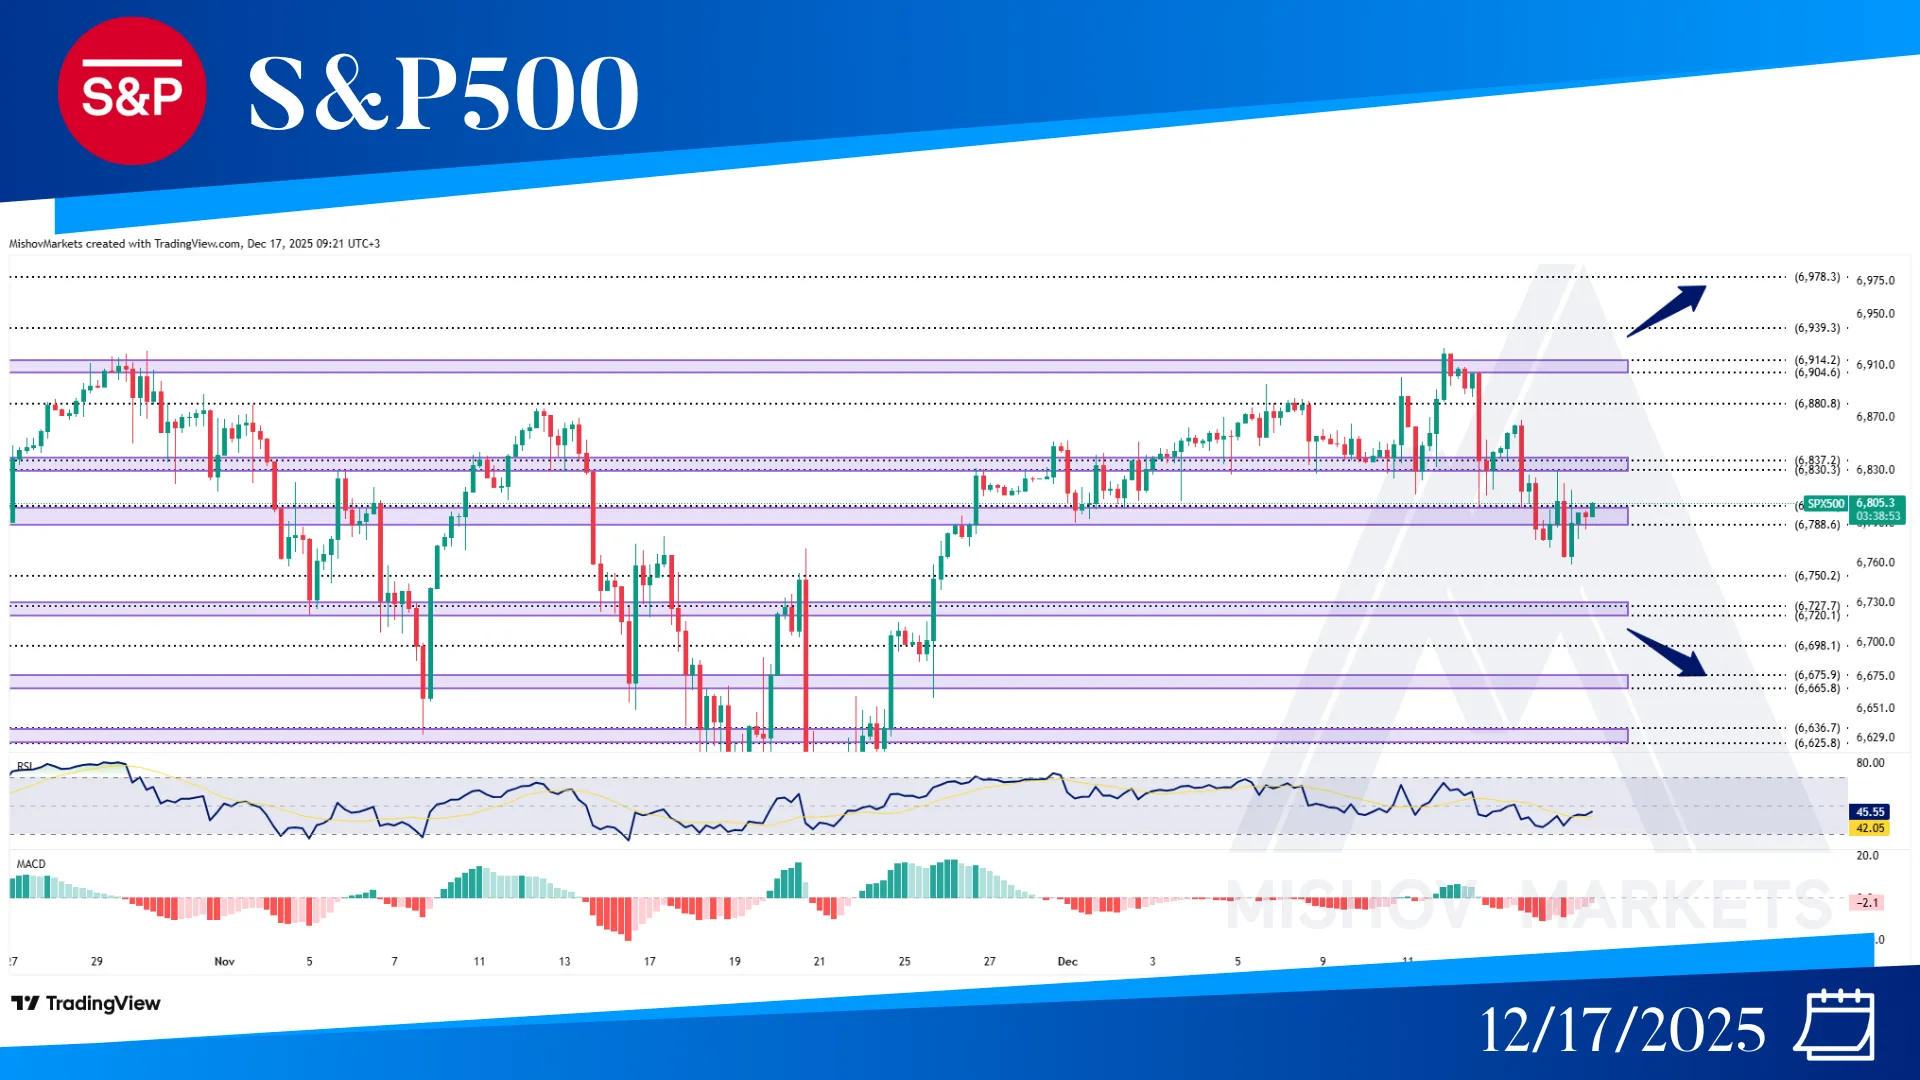
In the S&P 500, as mentioned in Monday’s analysis, the price reached the 6830 level and faced a resistance and moved toward the 6803-6788 zone. Now if the price breaks above this zone and provides a close above 6837, then it could reach our target at 6880 and 6914. Furthermore, if it continues to increase and provides a close above the 6930 level, it could reach our bullish targets at the 6939, 6978, and 7019-7031 zones. But if the 6803-6788 acts as resistance, then it could decrease toward the 6750, 6727-6720, 6698, and 6675-6665 zones to receive support from them.
