


Market Analysis 16 Feb 2026

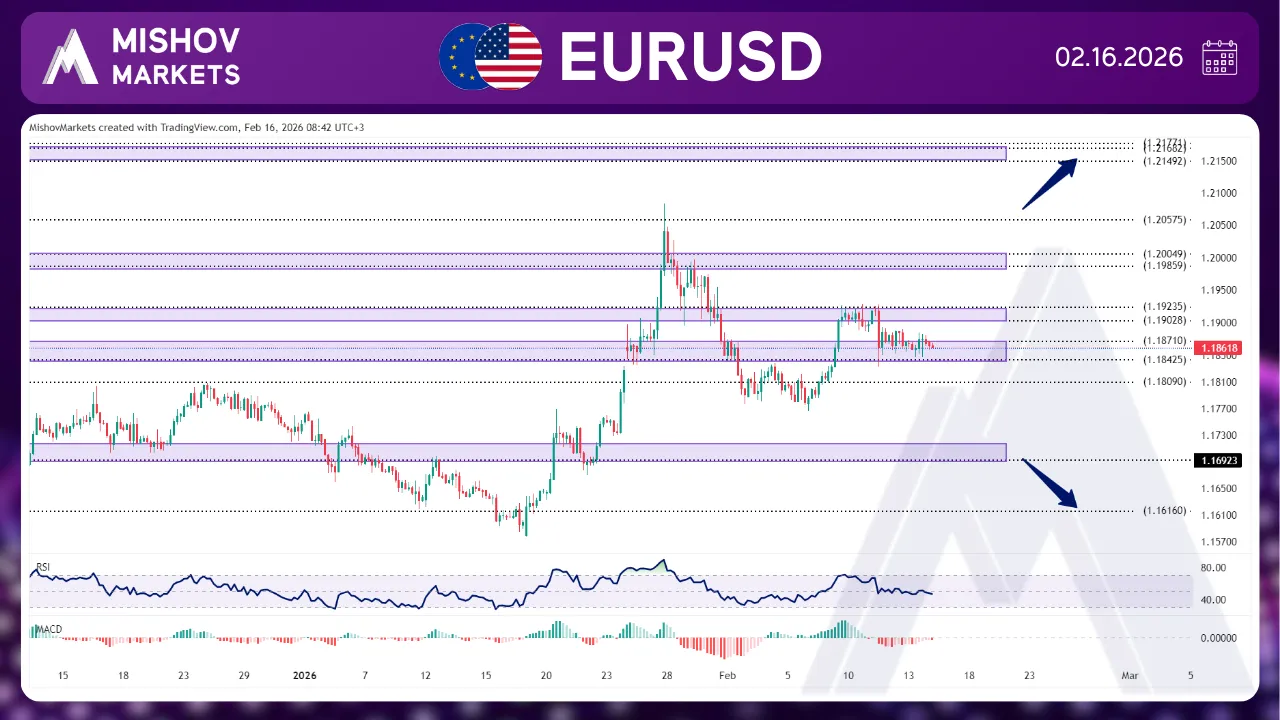
In EURUSD, as mentioned in our last analysis, the price received support at 1.18100 and continued to increase, reaching our targets in the 1.18400–1.18710 and 1.19020–1.19230 zones; however, after facing resistance in this zone, it decreased toward the 1.18400 zone to seek support. Now if the price continues to increase and breaks above the 1.19020-1.19230 range, it may continue to rise and reach our targets at 1.19850-1.20040 and 1.20575. Additionally, if it closes above 1.20850, it could further increase and reach our next targets at 1.21490-1.21770 and 1.23140-1. However, if the 1.18710-1.18400 zone fails to support the price, it could decrease toward 1.18100 and 1.17200 to seek support. Additionally, if the price breaks below these levels and 1.16160 does not provide support, it could move toward the 1.15320 level for support; but if this level also fails to support, then it could decrease further to reach targets at 1.14950, 1.13540–1.13750, and 1.13150–1.12890.
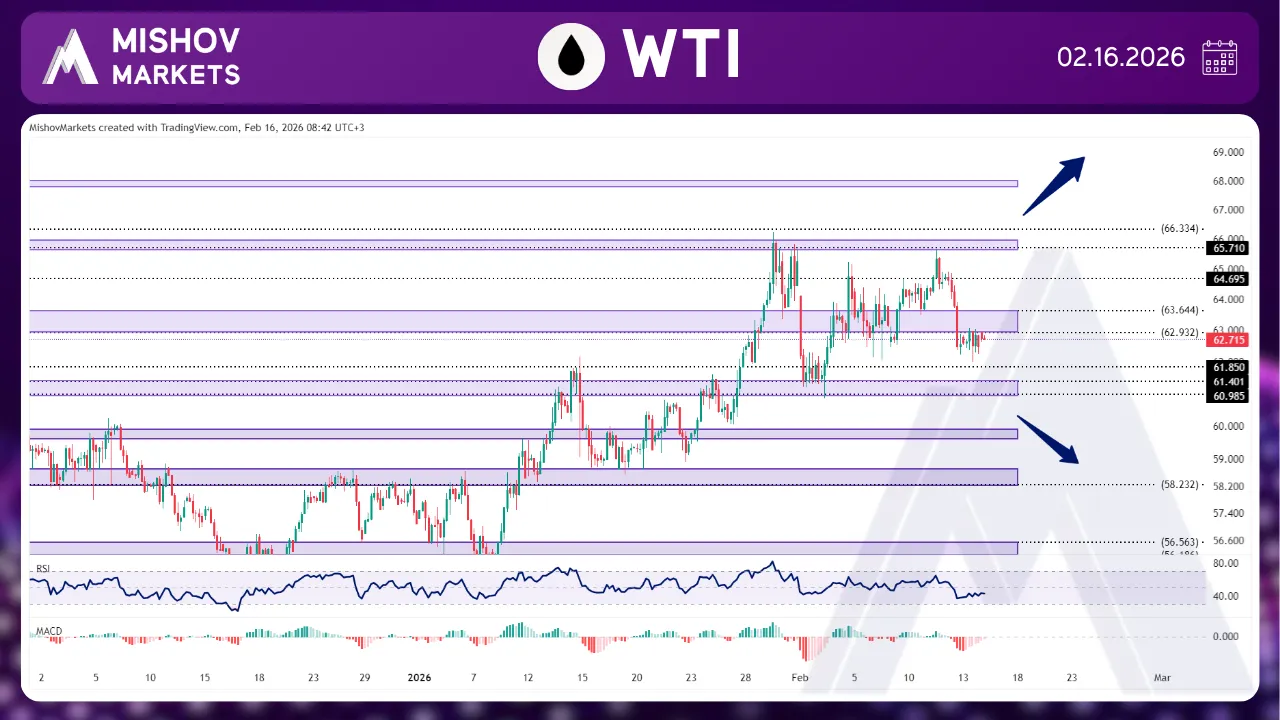
In WTI, as precisely mentioned in our last analysis, the price broke above the 62.900–63.350 zone and reached our targets at 64.690 and 65.710–65.980. After facing resistance, it declined toward 62.900 and 61.850. Now, if the price receives support from 61.850 or the 61.400–60.980 zone, it could move higher toward our target at 65.710–65.980. Additionally, if it closes above 66.250, the price may continue to rise toward 67.790–67.980, 69.100, and 70.640–70.860. However, if the 61.400–60.980 zone fails to act as support, the price could decline further toward 59.930–59.600 to seek support. Furthermore, if it breaks the 58.700–58.230 zone and provides a close below 57.400, it may continue to fall toward 56.570–56.180, 54.630, 52.020, and 49.880.
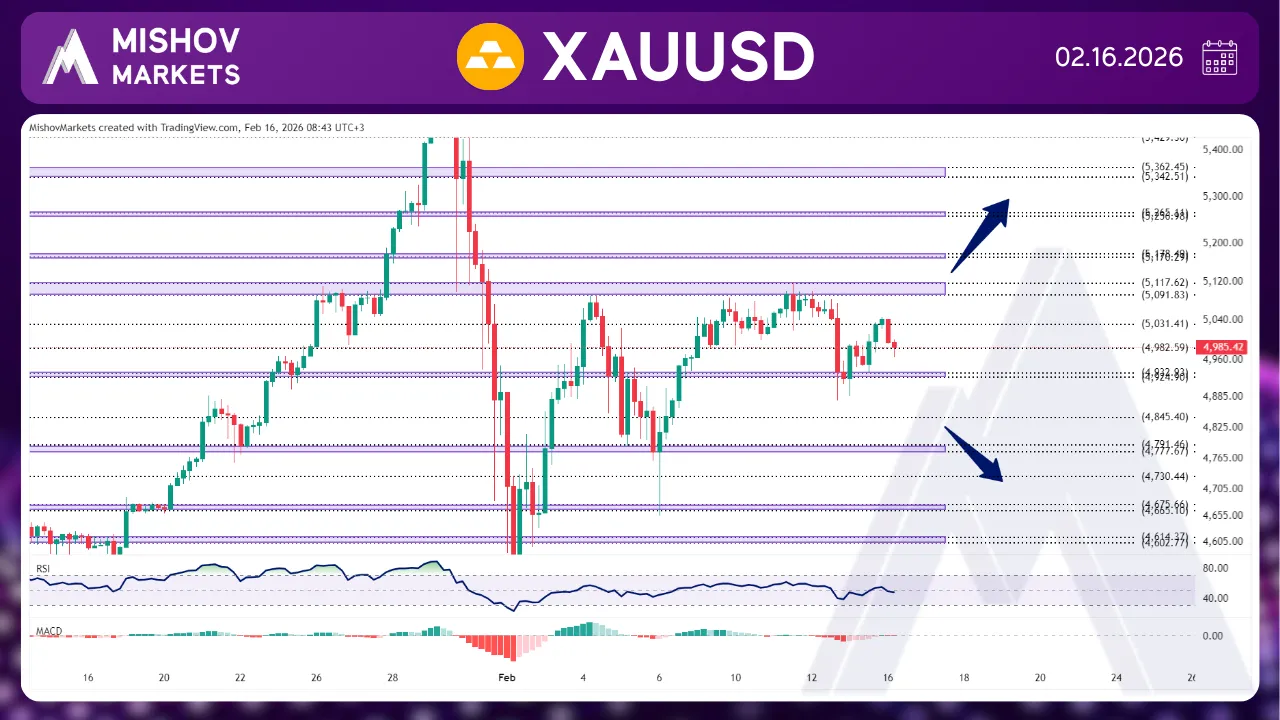
In XAUUSD, as outlined in our previous analysis, the price ultimately reached our target zone at 5091–5117 and encountered resistance, leading to a corrective move toward the 4982 and 4933–4924 levels. At this point, if the price resumes its upward momentum and breaks above the 5031 zone with a confirmed close above 5047, it may advance toward our next bullish targets at 5091–5117, 5170–5178, 5256–5265, 5342–5362, 5429, 5468, and 5567. Conversely, if the price faces resistance around the 5031 or 5091–5117 areas, it could reverse lower once again, heading toward the support zones at 4982, 4933–4924, 4883, 4845, 4791–4777, 4730, 4675–4665, 4614–4602, 4574–4566, and 4488–4482.
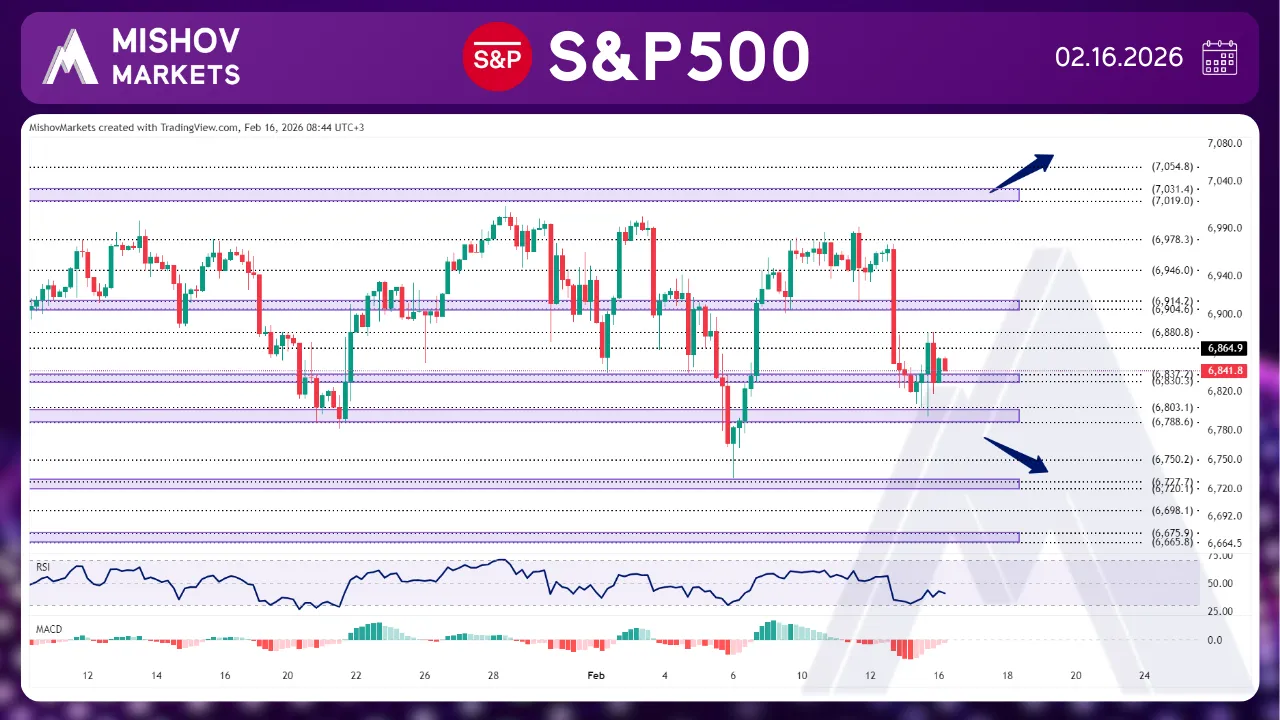
In the S&P 500, as highlighted in our previous analysis, the price extended its bullish move and reached our target at 6978, where it encountered resistance and retraced lower toward our targets at 6914–6904, 6880, 6837–6830, and 6803–6788. At this point, if the price receives support within the 6837–6830 zone and starts to increase, it may advance toward the 6904–6914, 6946, and 6978 levels again. Moreover, a confirmed breakout above 6978 with a close above 6995 could open the door to new all-time highs at 7019–7031, 7054, and 7118–7141. Conversely, if the 6837–6830 or 6803–6788 zones fail to hold as support, the price could decline toward 6785. A further break below the 6727–6720 area may lead to deeper losses toward 6698, 6675–6665, 6636–6625, 6611, and 6573–6564.
