


Market Analysis 11 Jun 2025

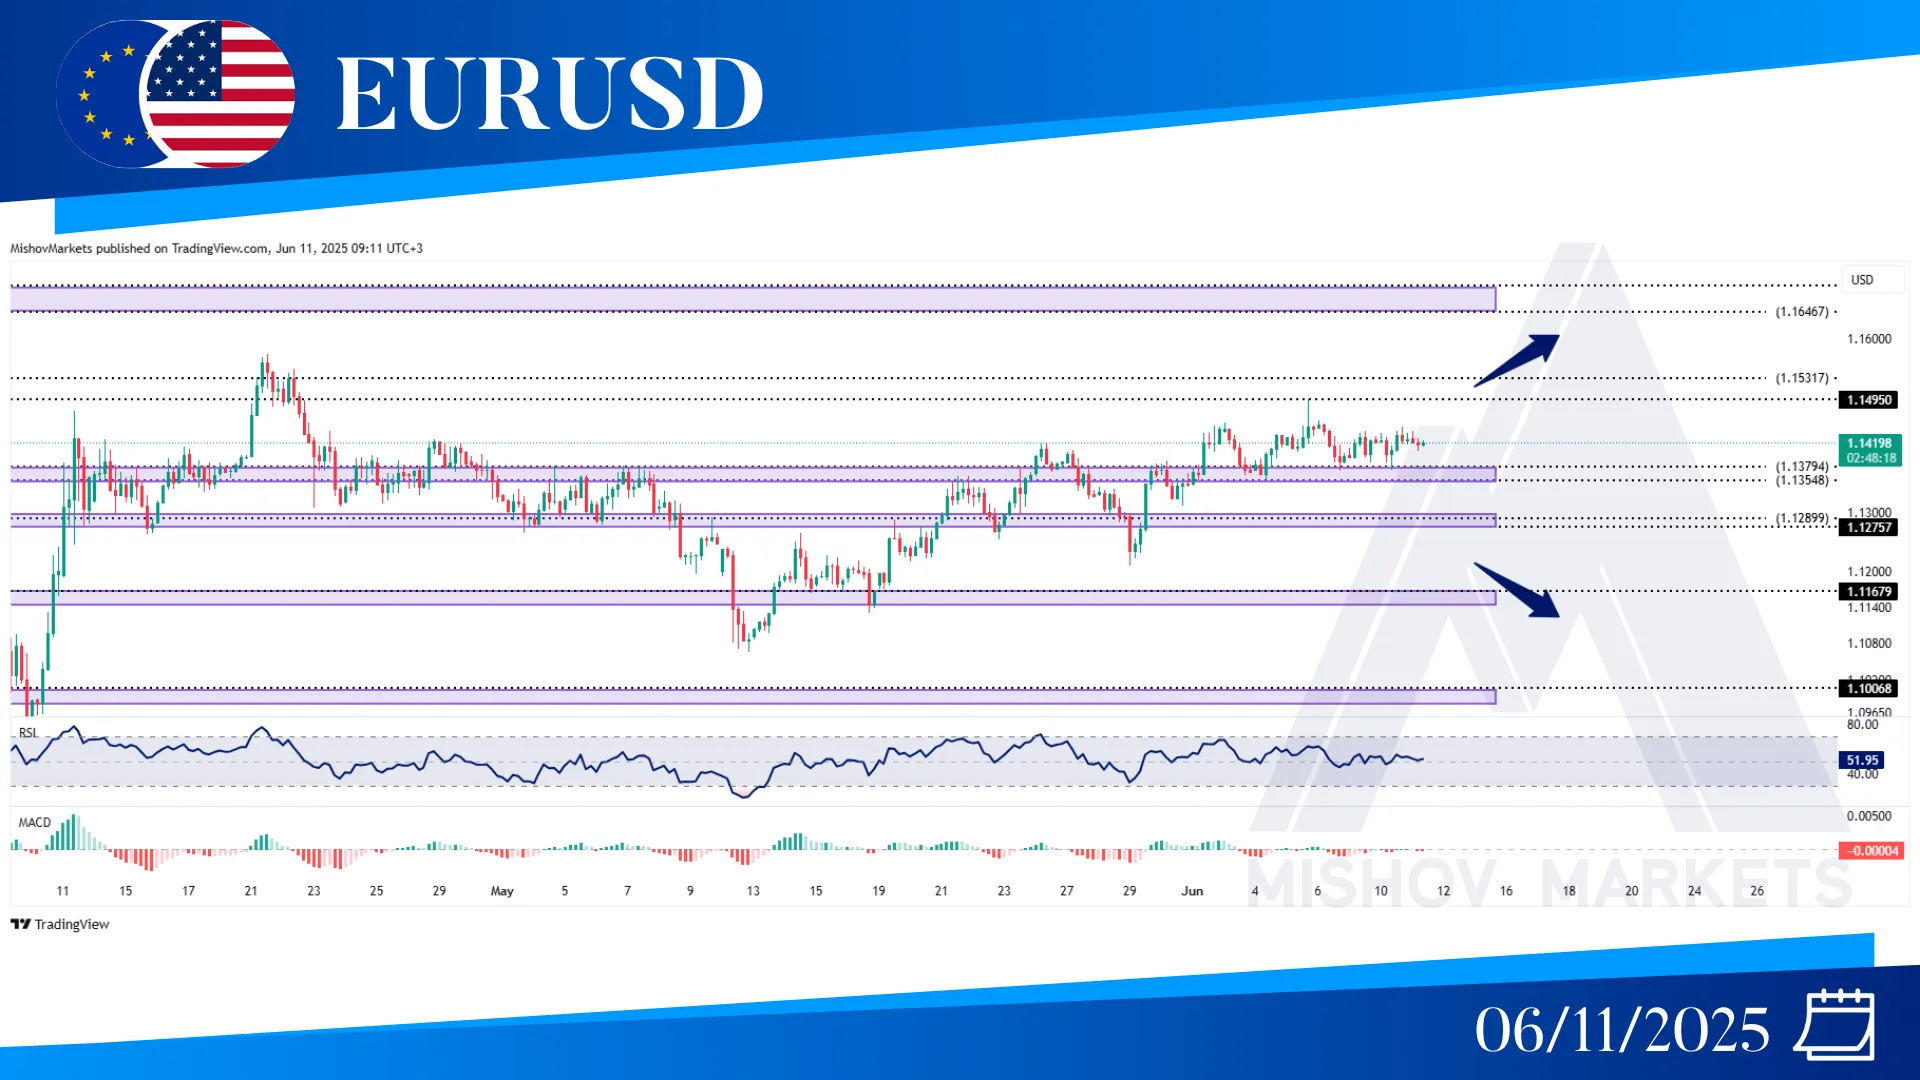
In EURUSD, as mentioned in Monday’s analysis, the price is trading between two levels: 1.13540–1.13750 and 1.14950–1.15310. If it breaks above this trading range, it could move toward 1.16460–1.16920 and 1.18420. But if the price breaks below this zone, it could move toward the 1.12890 and 1.11670 zones, and if it breaks below 1.11300, then it could decrease further toward 1.10060, 1.09370, and even the 1.0800 zone.
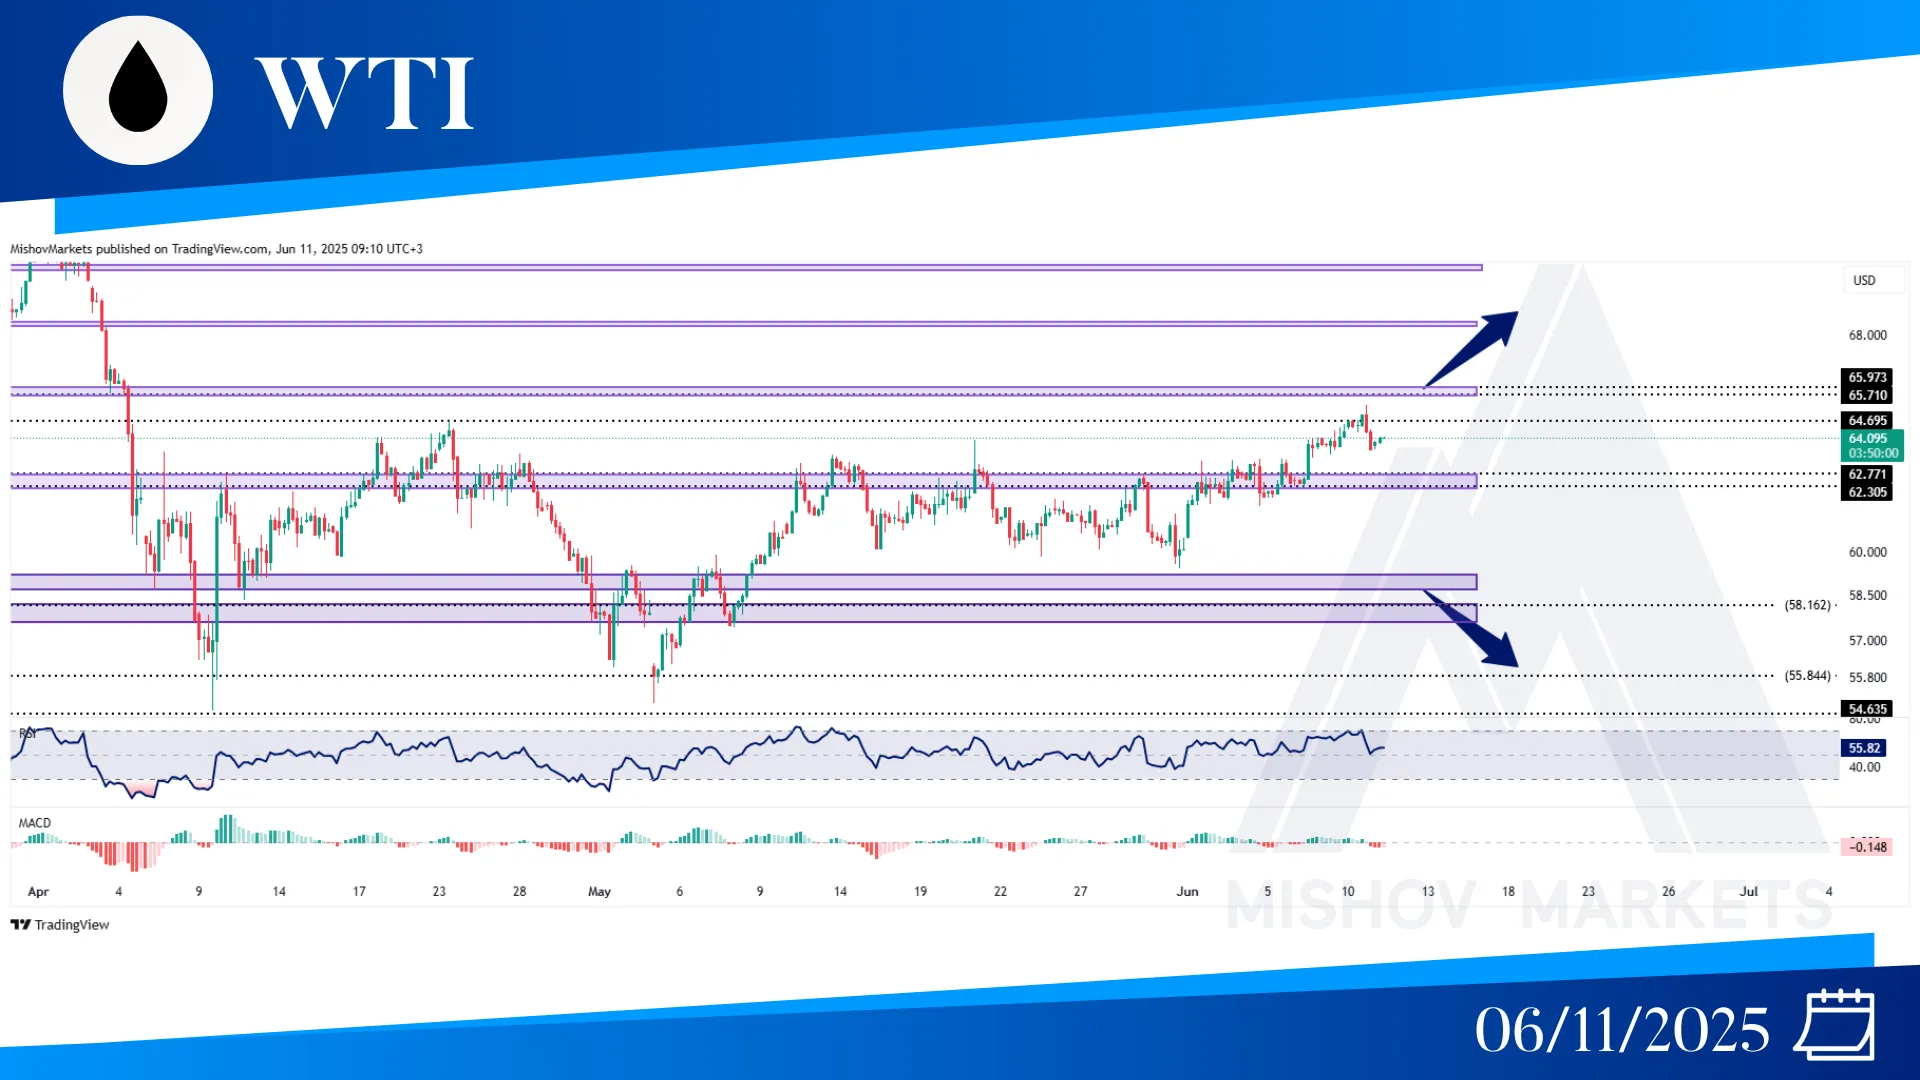
In WTI, as precisely mentioned in Monday’s analysis, the price continued its bullish momentum and reached our target at 64.690. Now the price might come back to test the 62.770-62.300 before moving toward our next targets at the 64.695, 65.700-65.970 and 68.280-68.500 zones. But if the 62.770-62.300 zone is unable to provide support and it breaks, then the price could start to decrease toward 59.400, and if this zone breaks as well then it could reach the 59.200-58.800 and 58.140-57.600 zones.
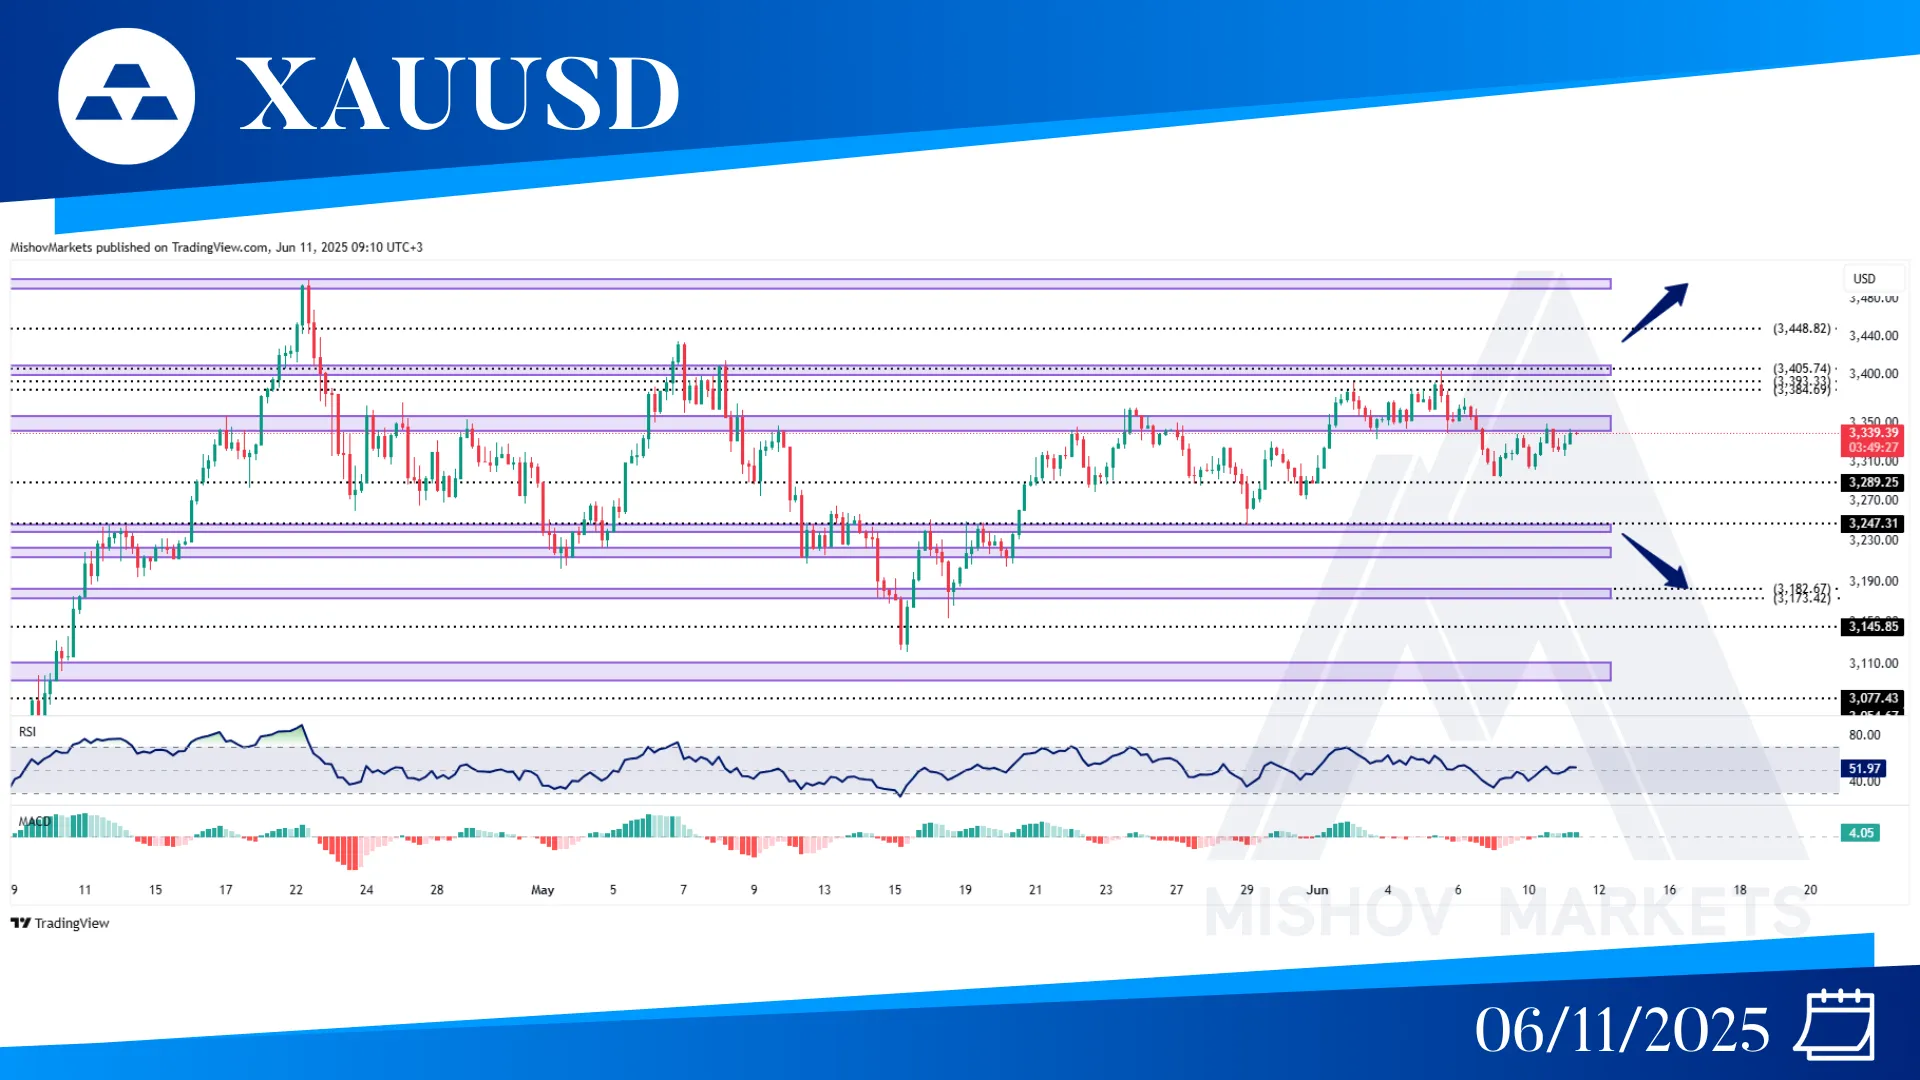
In XAUUSD, as precisely mentioned in Monday’s analysis, the 3342-3356 zone has acted as resistance a couple of times, and if the price breaks above this zone, then it could reach the 3384, 3393-3405, and 3448 zones. But if it fails to break above these zones, it could decrease further to test the 3289, 3239–3247, or 3220–3211 zones once more, and then if these zones also fail to support the price and we observe a price close below 3150, it could decrease further toward the 3112–3097, 3077, 3054, and 2996–2988 zones.
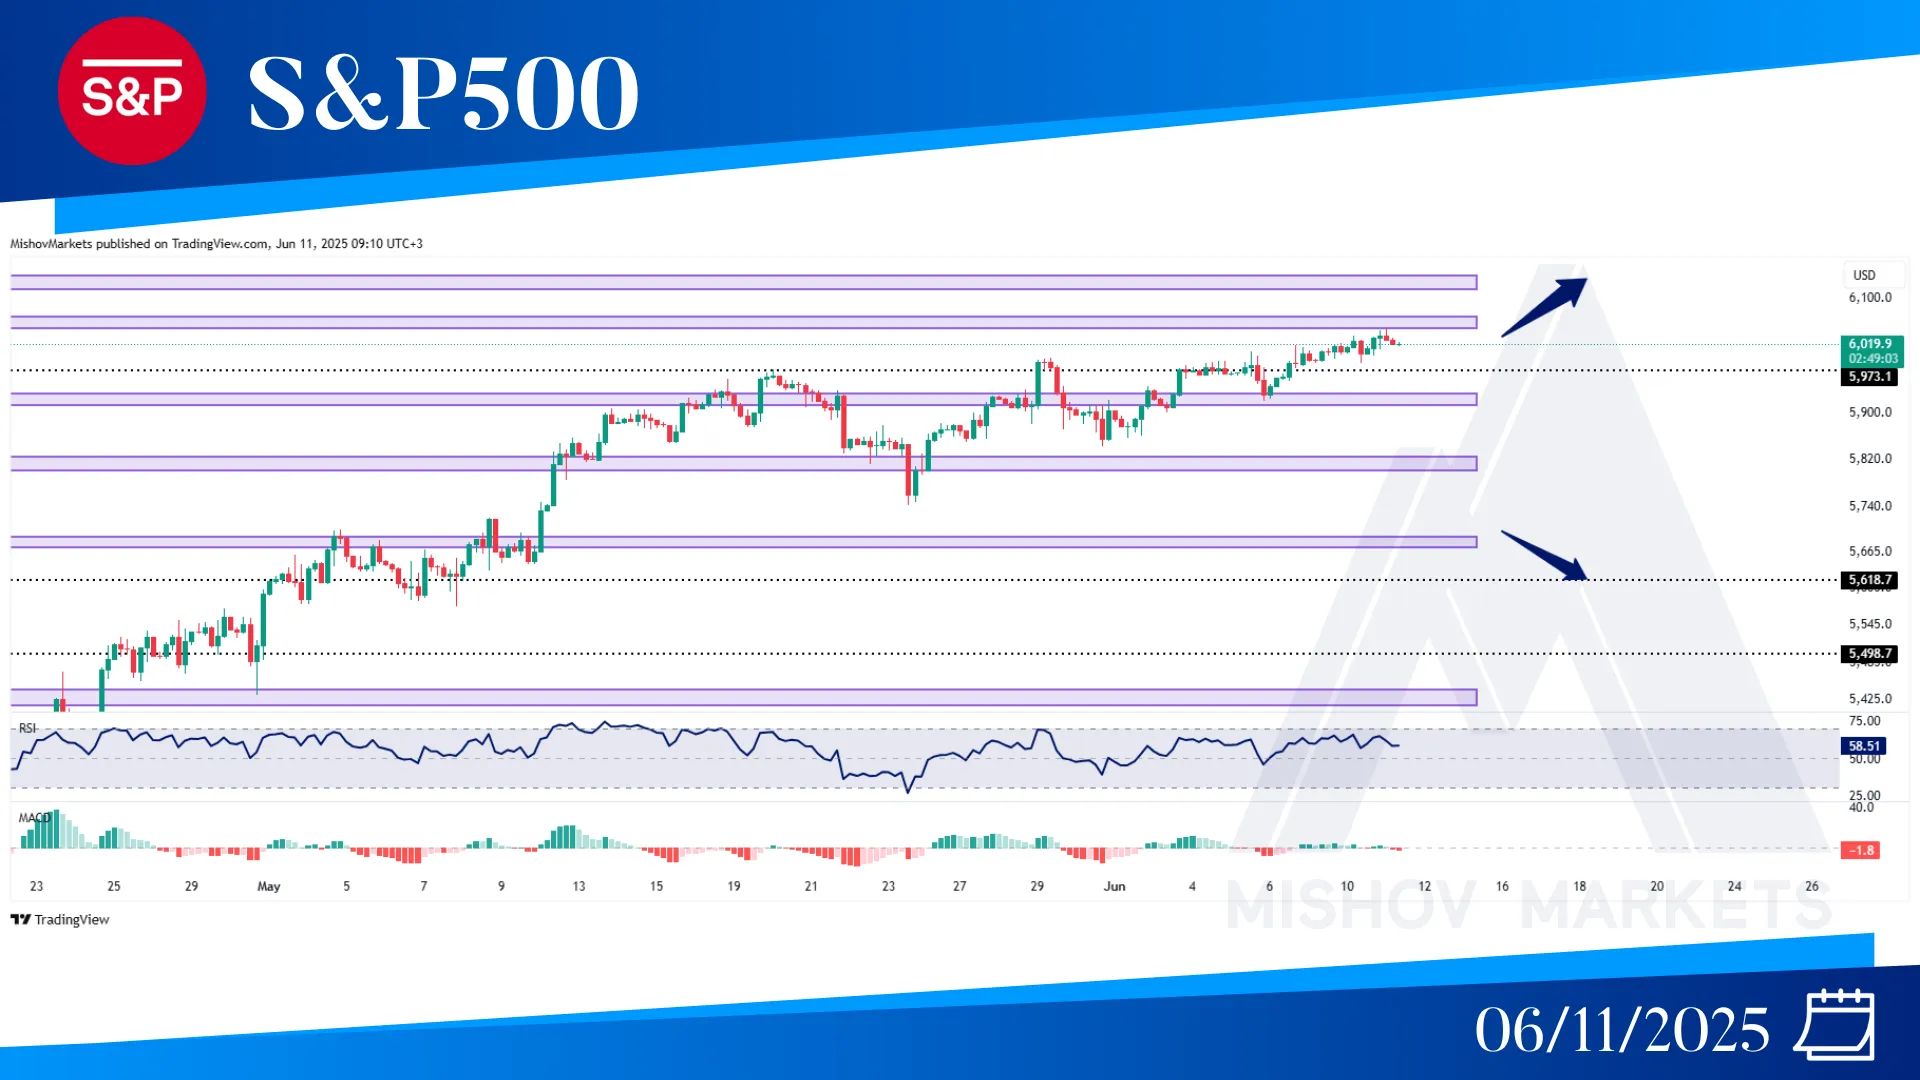
In the S&P 500, as precisely mentioned in Monday’s analysis, the price was finally able to break above the 5973 zone with a close above 6018 and continued to move toward our target at 6041-6068. Now the price might come back to test the 5973 zone and then move toward the 6041-6068 and 6120-6136 zones. However, if the price breaks below 5973, it could decrease toward 5740 or 5692-5674.
