


Market Analysis 10 Sep 2025

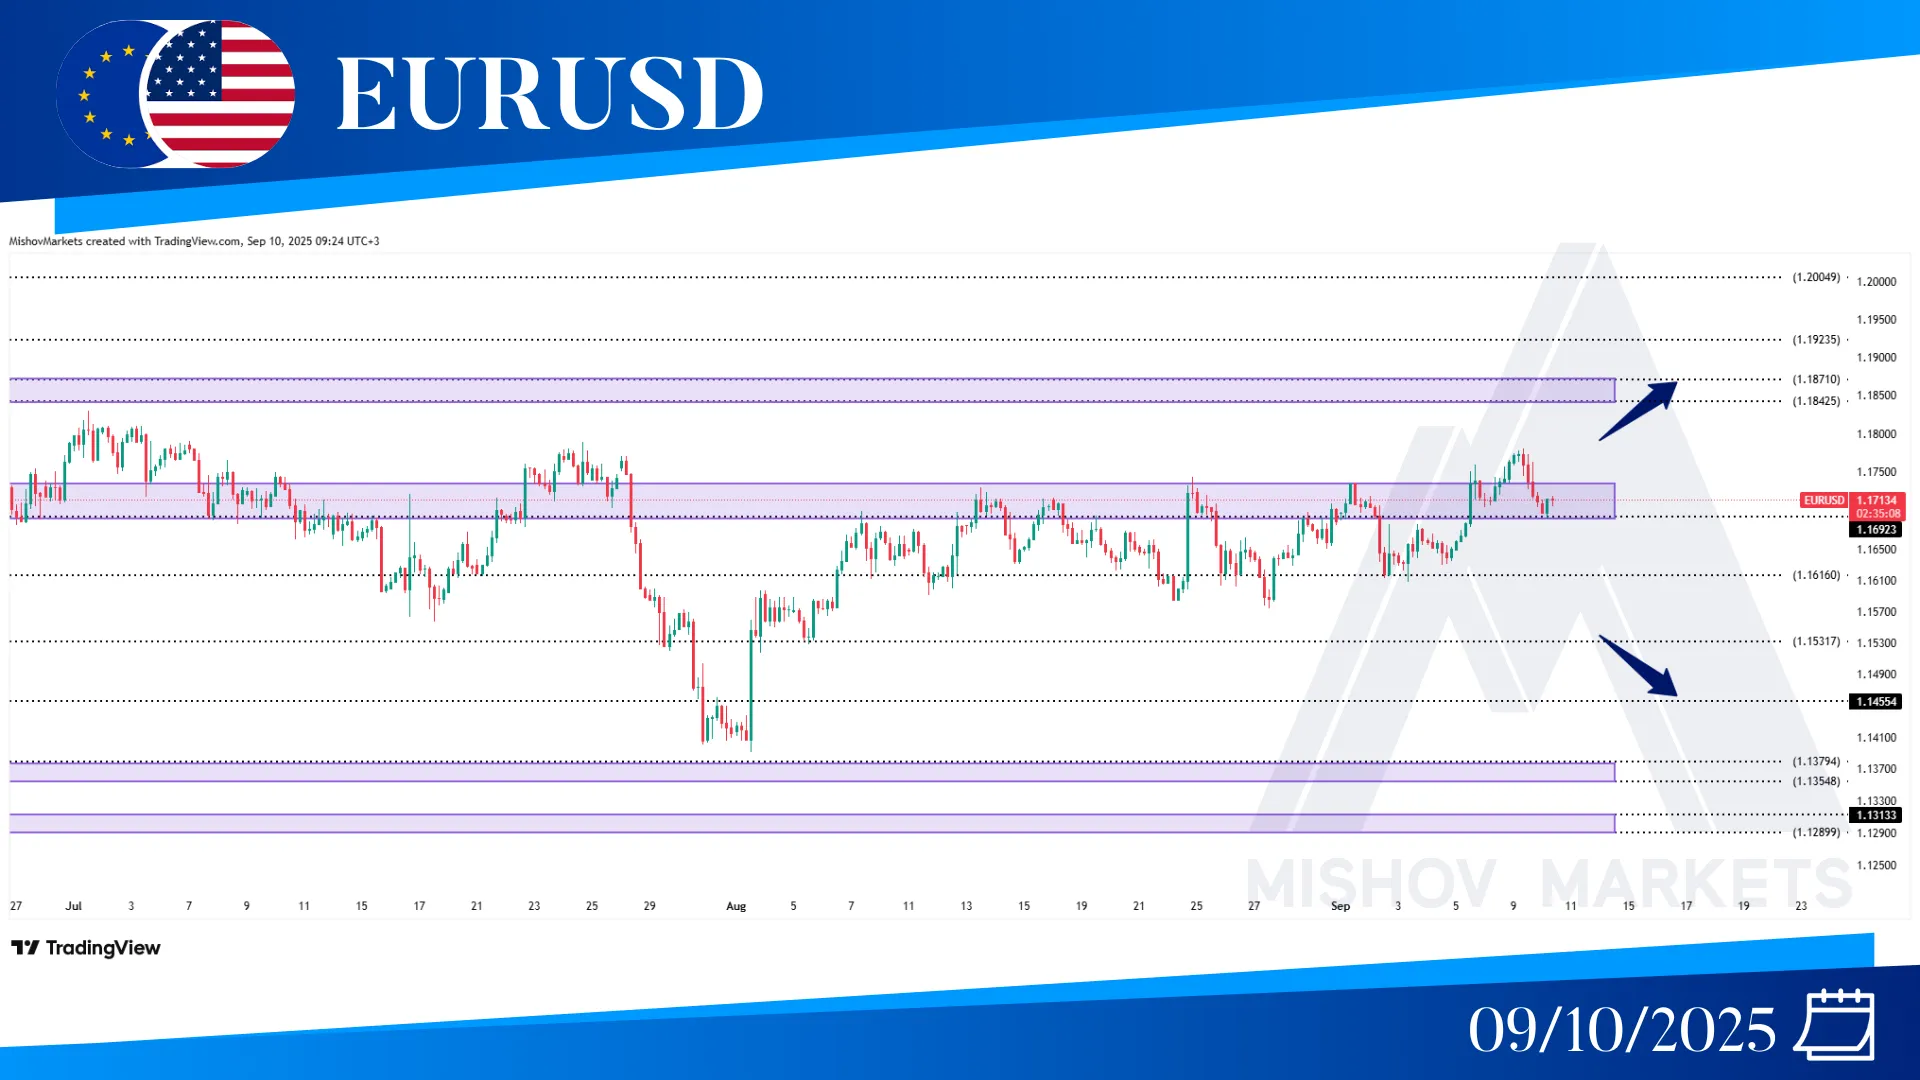
In EURUSD, as precisely mentioned in Monday’s analysis, the price is trying to break above 1.17500. Now if it receives support from the 1.16930, it could reach 1.18420-1.18710, 1.19230, or possibly 1.20040. However, it might come back to the aforementioned trading range (1.16160-1.17400), but if it falls below 1.15900, it could decrease to 1.15310, and then if this zone fails to support the price, it could decrease further toward our targets at the 1.14550 and 1.13540-1.13750 zones.
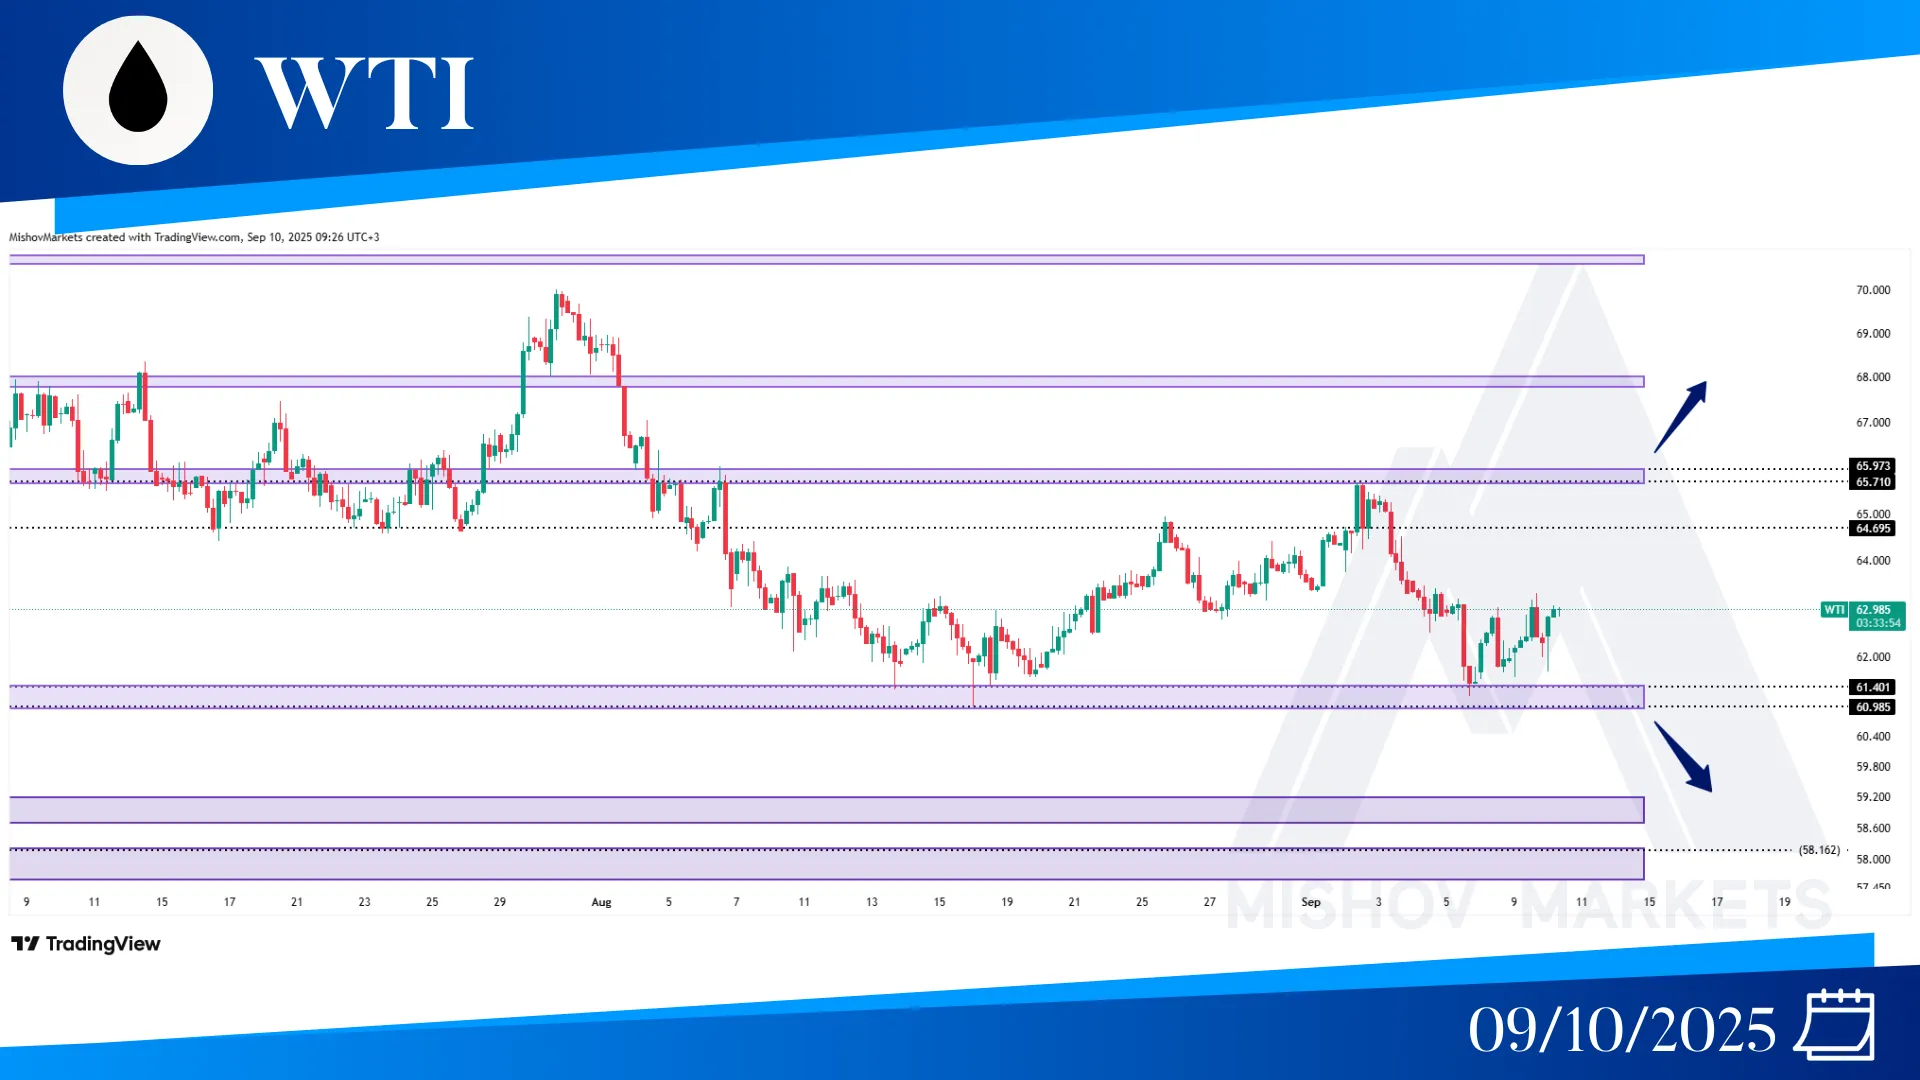
In WTI, as mentioned in Monday's analysis, it seems that the 61.400 zone has acted as support and the price has started to increase toward our targets. But due to geopolitical tensions, we might see abnormal behavior in the chart. If the 61.400 level supports the price, it could rise again toward 64.690 and the range of 65.700-65.970; additionally, if it breaks above the 65.710 level and closes above 66.100, it may continue to increase toward the ranges of 67.790-67.980 and 69.100. But if 61.400-60.990 fails to support the price, then it could decrease further toward the ranges of 59.200-58.840 and 57.800-58.100.
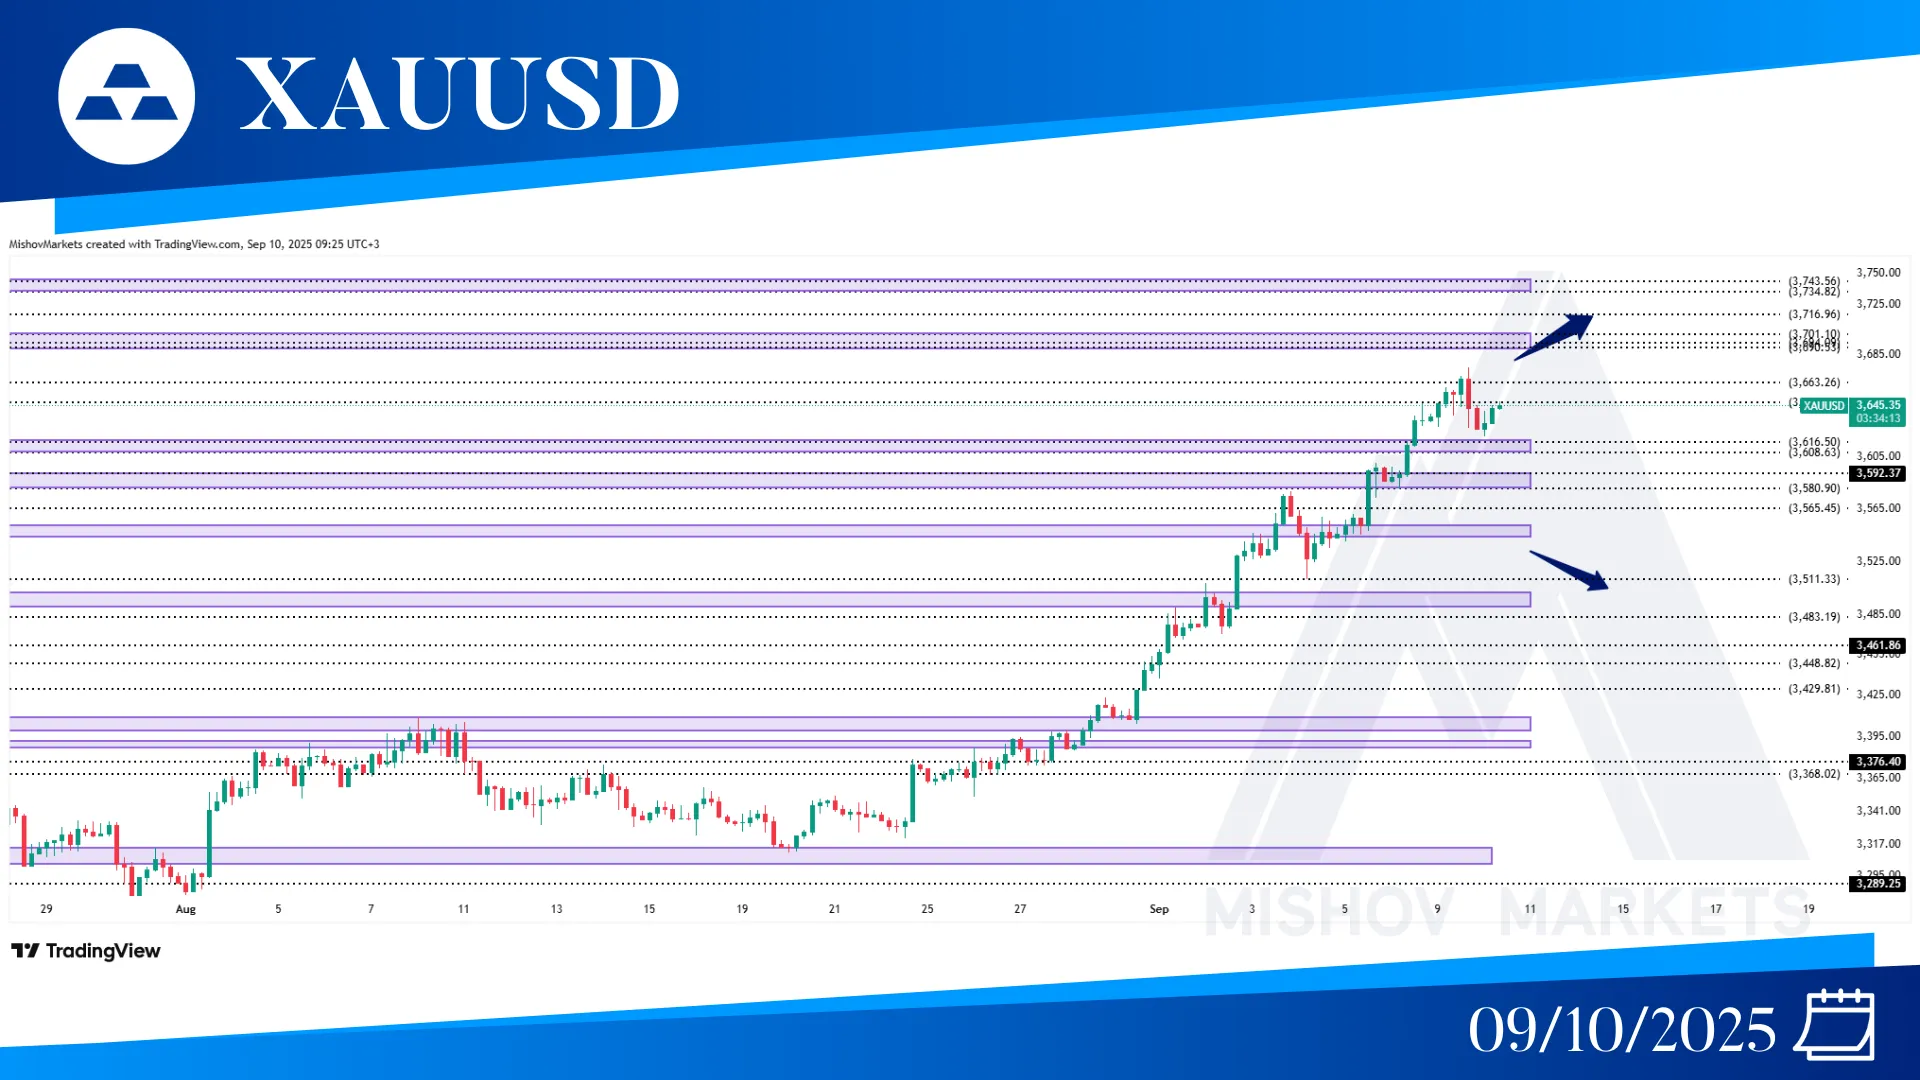
In XAUUSD, as precisely mentioned in Wednesday’s analysis, the price continued to increase and provided a close above 3601 and started to reach our targets at 3608-3616, 3647, and 3663. Now if the price continues to increase and provide a close above 3675, then it could continue to move toward 3690-3694, 3701, 3716, and 3734-3743. But if the 3663 or 3674 level acts as resistance, then it could start to retrace some of its movements toward 3616-3608, 3592-3580, 3565, 3552-3546, 3511, 3501-3490, and 3483 to receive support. At this point, if 3461 fails to support the price, then it could decrease further toward the 3448, 3429, 3409-3400, and 3391-3387 zones.
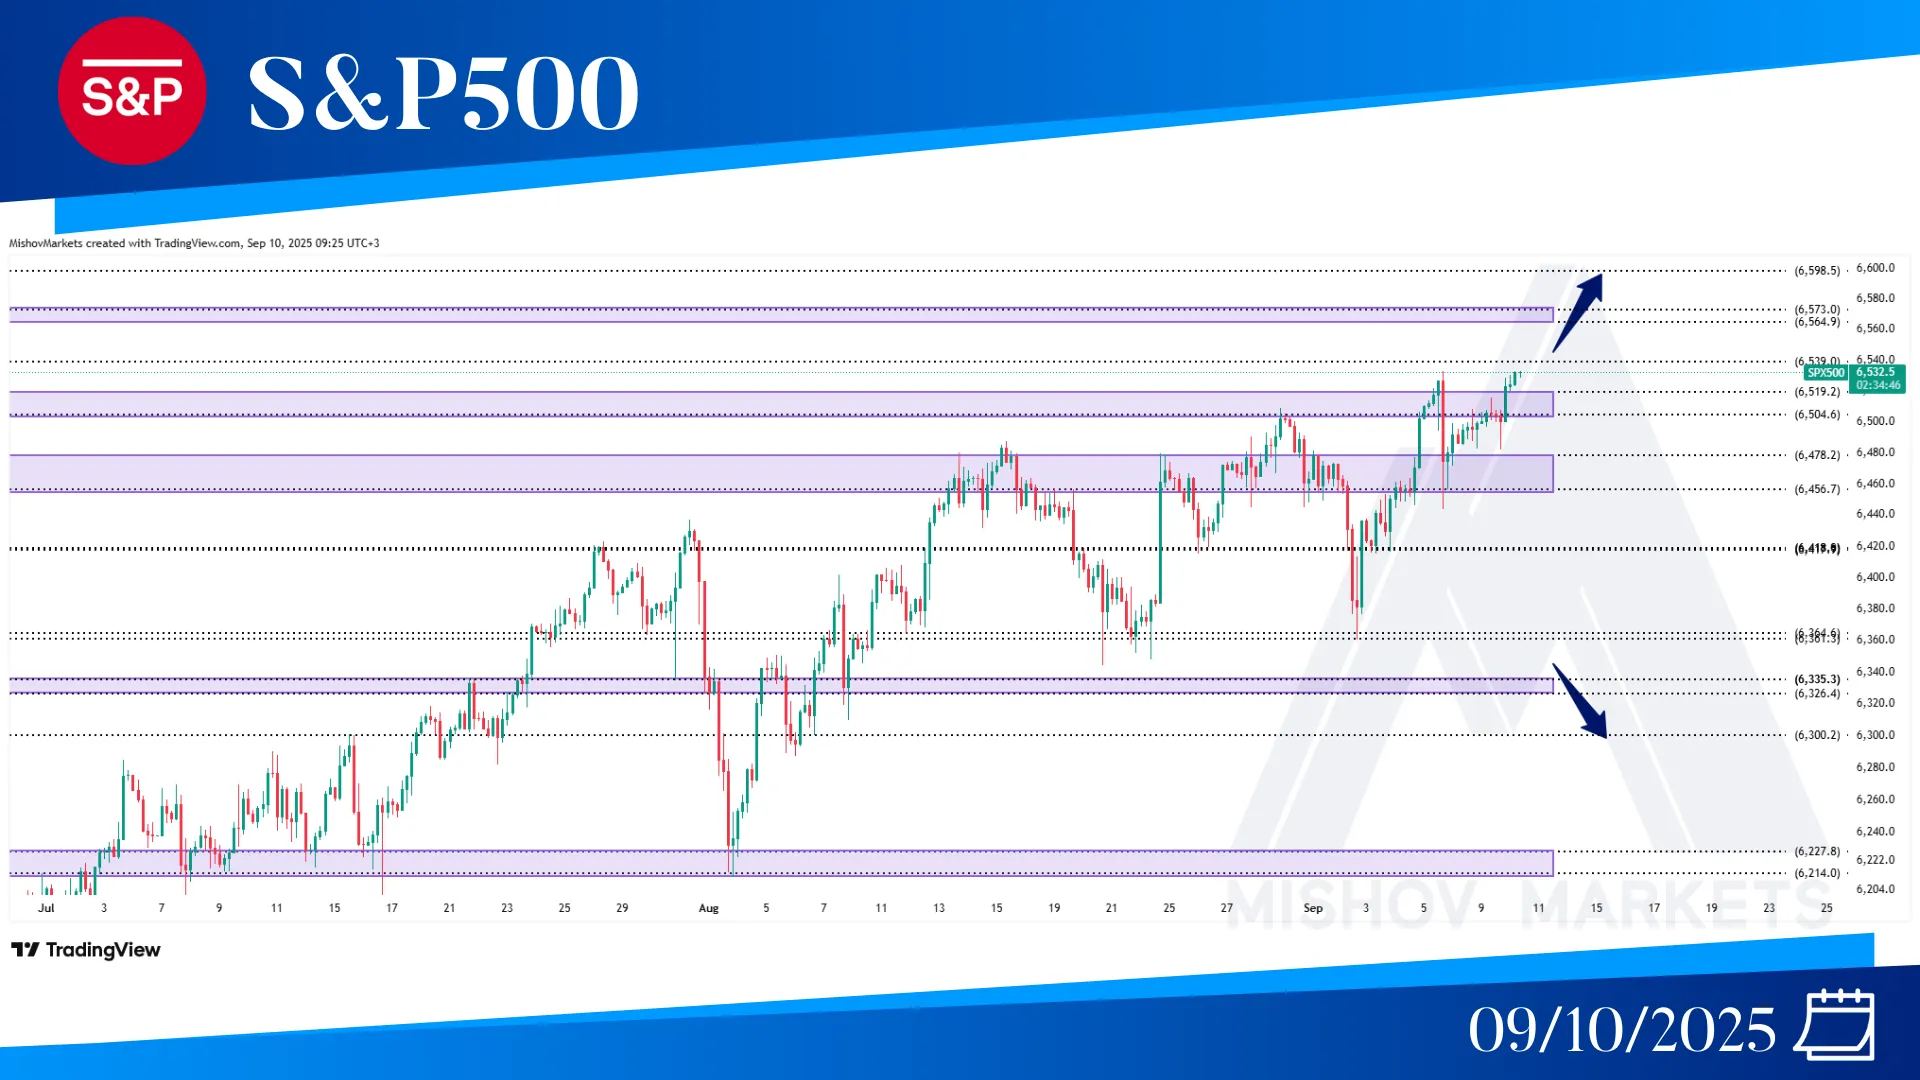
In the S&P 500, the analysis from Monday precisely mentioned that the 6458 zone acted as support, pushing the price toward our targets at 6504-6519 and 6539. Now if the 6539 level acts as resistance, it could decrease and reach our targets at 6504-6519, 6456-6478, and 6418. If any of these zones acts as support or the straight break above 6539, then it could increase toward 6564-6573, 6598, and 6625-6636. But if this zone fails to support the price, then it decreases further toward our target at 6361-6364 and 6335-6326 to receive support, but if these zones also fail to do so, then it could decrease further toward 6300, 6227-6214, 6177, and 6132-6119.
