


Market Analysis 09 Mar 2026

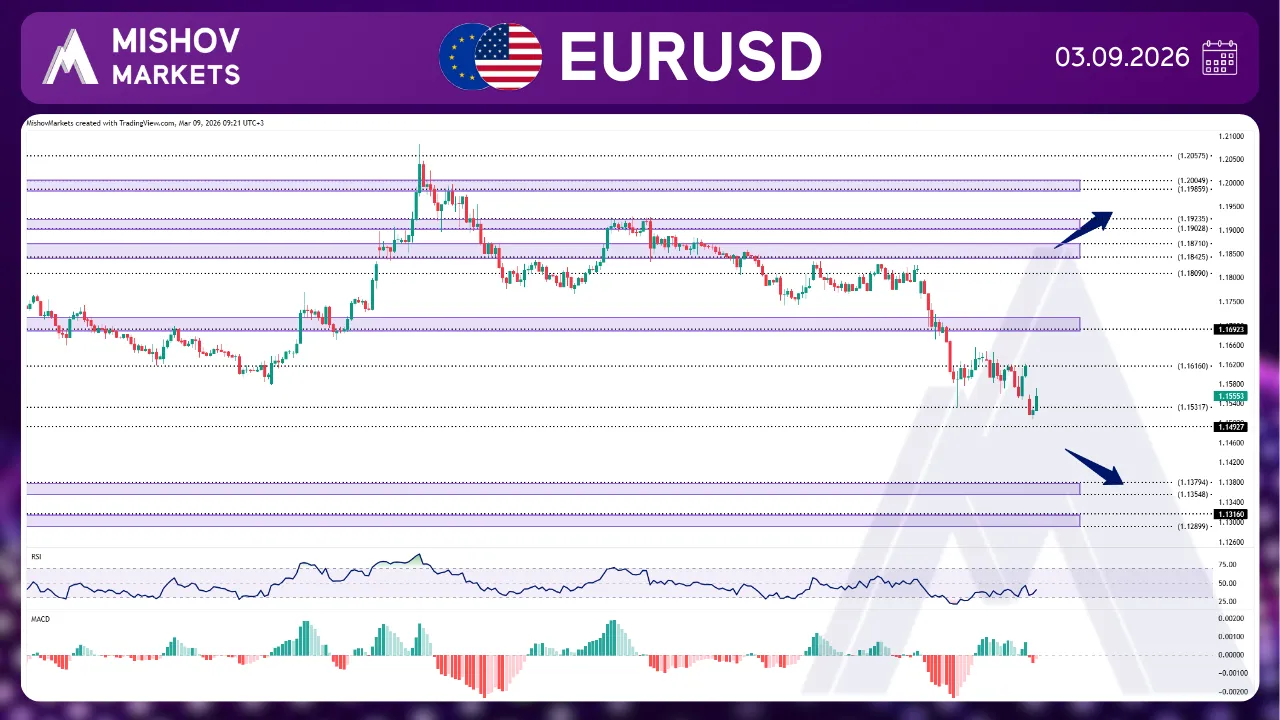
In EURUSD, as mentioned in Wednesday’s analysis. The price was unable to break above the 1.16160 level and after facing resistance in this zone, it has returned to 1.15320 once more. Now if the price receives support from this zone and breaks above 1.16540, it could move toward 1.16920-1.17200 and 1.18090. If it closes above 1.18300, it could then move toward 1.18420-1.18700 and 1.19020-1.19230. However, if the price fails to find support in the 1.15320 range, it could lead to further downside toward 1.14950, 1.13540–1.13750, and 1.13150–1.12890.
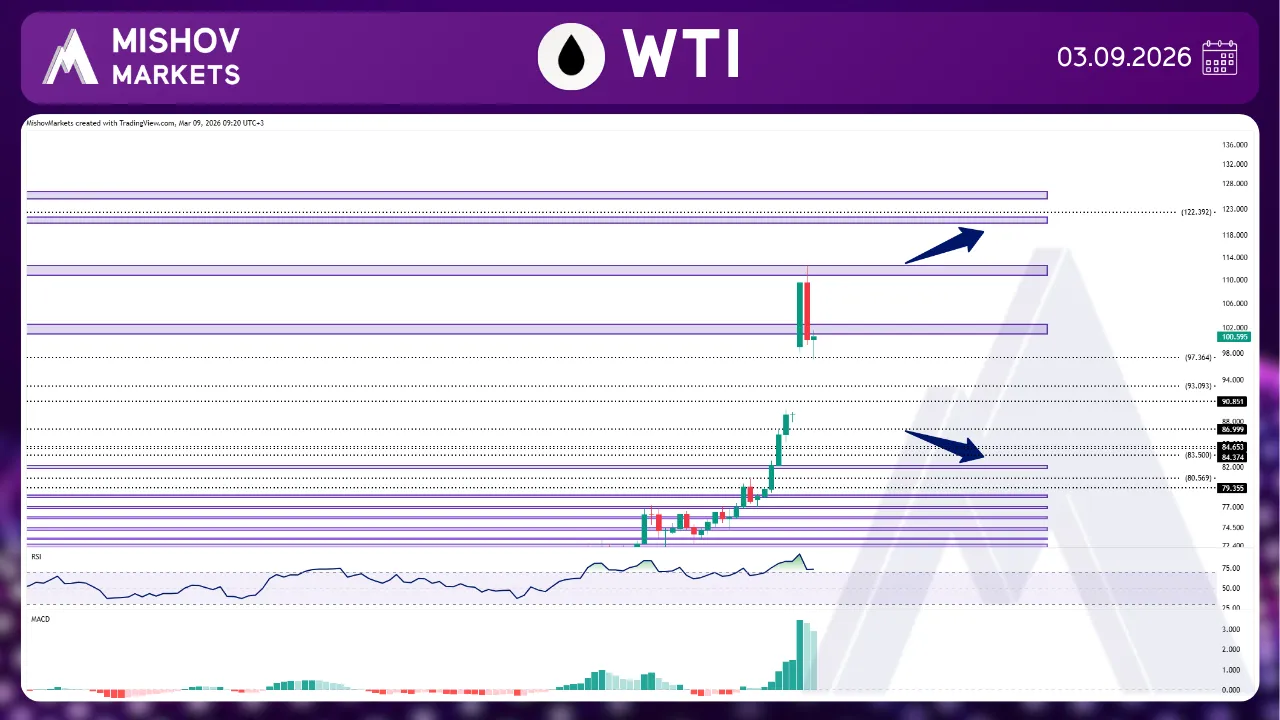
In WTI, as precisely mentioned in Wednesday’s analysis, rising tensions in the Middle East pushed prices higher. The price managed to close above 77.200, extending its rally toward our targets at 78.130–78.390, 79.350, 81.970–82.200, and 84.370–84.650. Following a sharp upside gap, the price surged further and reached the 101.020–102.540 and 111.130–112.680 zones. At this stage, if bullish momentum remains strong and the price provides a confirmed close above 112.900, further upside may follow toward 120.300-121.450, 122.390, 124.940-126.340, and 152.230. On the downside, if the price faces resistance and closes below 97.360, it may decline toward the 93.090, 90.850, and 87.000 zones to look for support. Moreover, if these areas fail to hold, a deeper breakdown could push prices toward 84.370–84.650, 81.970–82.200, 79.350, and 78.130–78.390.
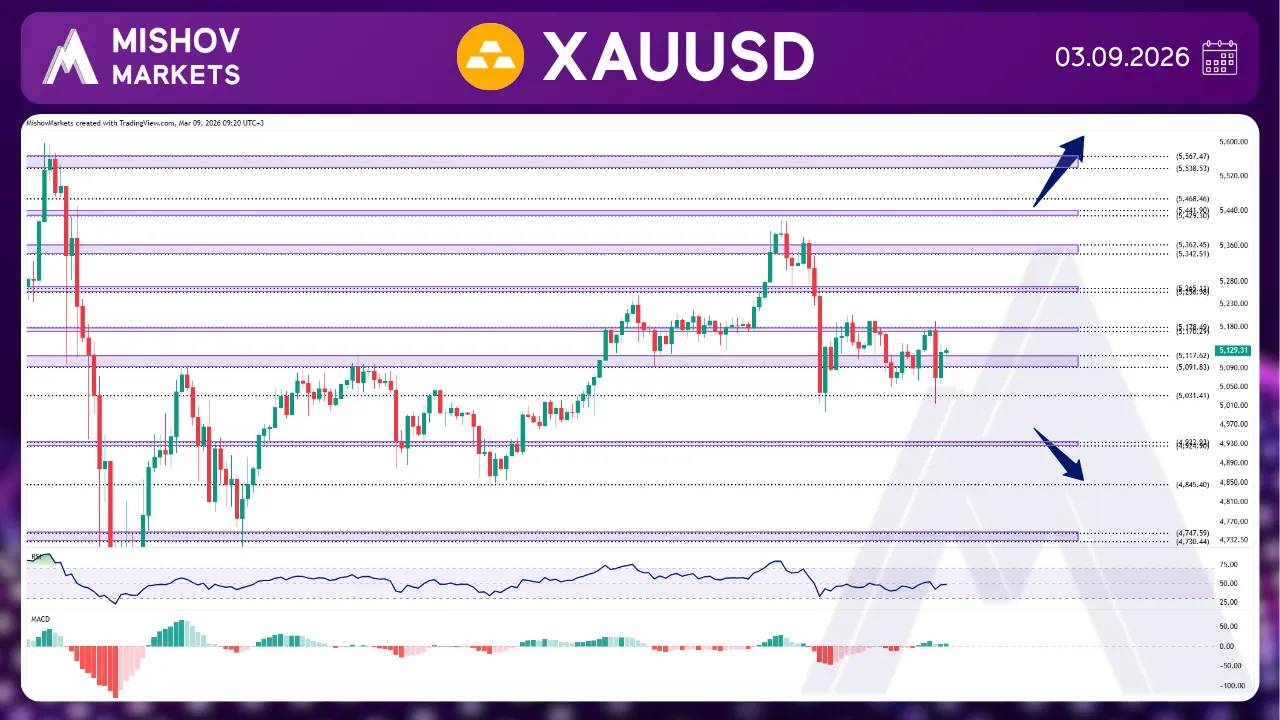
In XAUUSD, As precisely mentioned in Wednesday’s analysis, the 5170–5178 zone acted as resistance, causing the price to decline toward our targets at 5117–5091 and 5031. After finding support in this area, the price rebounded and moved back toward the 5091–5117 zone. At this stage, if the price breaks above this zone and bullish momentum persists, a confirmed close above 5120 could open the way for further upside toward 5256–5265, 5342–5362, 5429–5441, 5468, 5538–5567, and 5647. Conversely, if the 5117–5091 zone acts as resistance, the price may resume its decline toward 5031 once again. Moreover, a decisive break below 4996 could trigger a renewed bearish move toward lower support levels at 4983, 4924–4932, 4845, 4747–4730, 4675–4665, 4614–4602, 4574–4566, and 4488–4482.
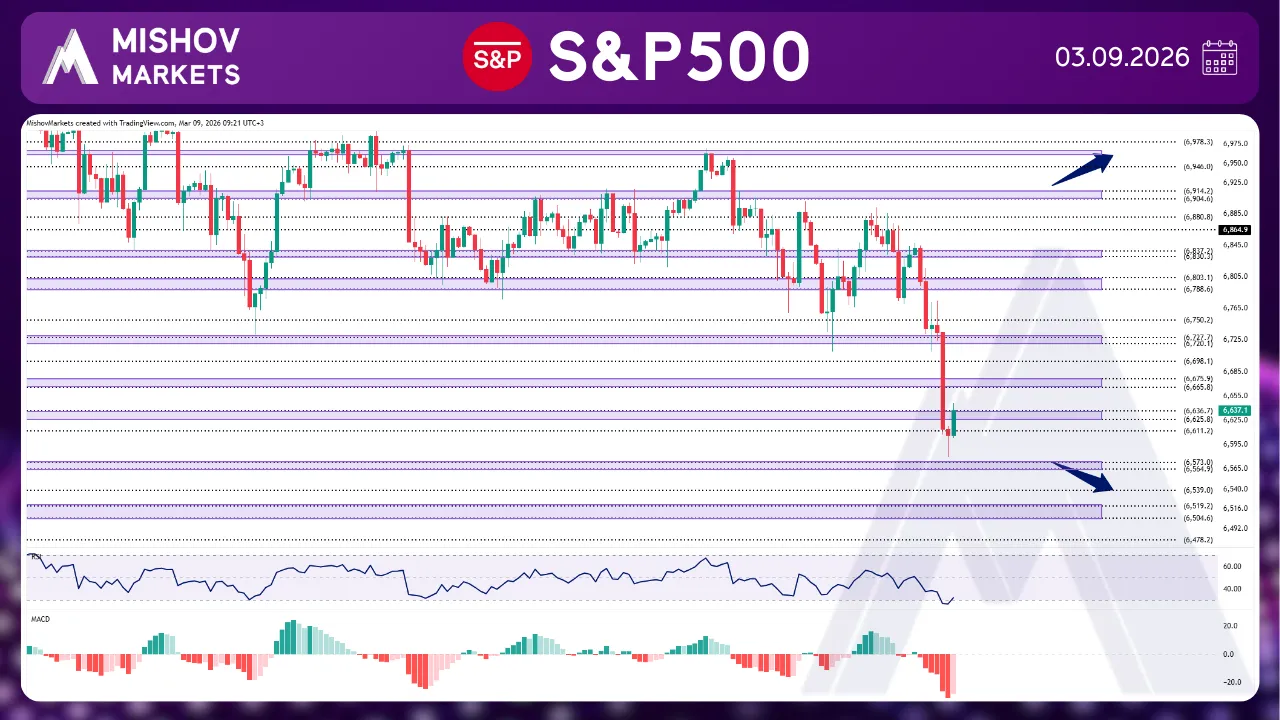
In the S&P 500, As precisely mentioned in Wednesday’s analysis, the price initially found support and advanced toward our targets at 6864 and 6880. After encountering resistance at this level, the index reversed lower and declined to our bearish targets at 6698, 6675–6665, 6636–6625, 6611, and 6573–6564. At this stage, if the price finds support, it may retrace part of its recent decline and move toward 6665–6675, 6698, 6720–6727, and 6750. However, if these zones act as resistance, the index could turn lower again toward the 6573–6564 area. A break below this support may trigger deeper losses toward 6539, 6519–6504, 6478, and 6446. Conversely, if the price gains bullish momentum and breaks above 6880, with a confirmed close above 6900, the index could resume its upward movement toward 6904–6914, 6946, and 6961–6967.
