


Market Analysis 09 Feb 2026

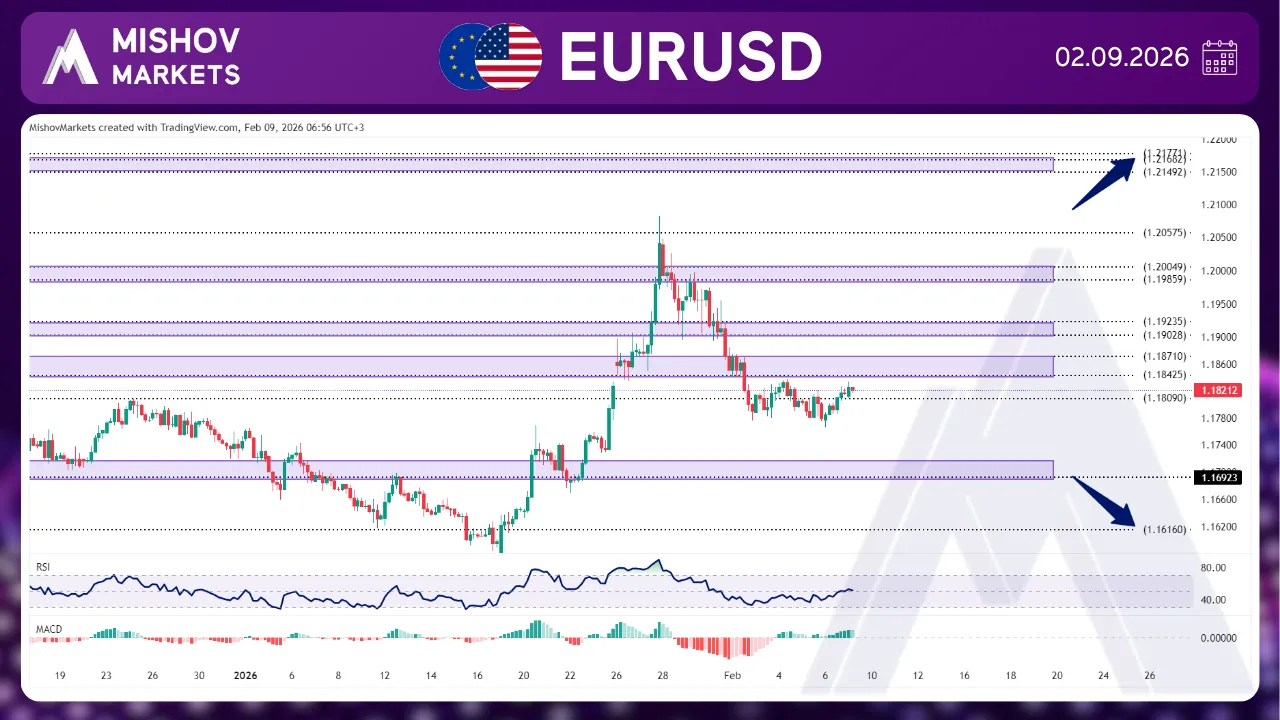
In EURUSD, as mentioned in Wednesday's analysis, the price faced resistance at the 1.18710-1.18400 zone and once more started to decrease and reached our target at the 1.18100 zone. Now if the price receives support and breaks above the 1.18400-1.18710 range, it may continue to rise and reach our targets at 1.19020-1.19230, 1.19850-1.20040, and 1.20575. Additionally, if it closes above 1.20850, it could further increase and reach our next targets at 1.21490-1.21770 and 1.23140-1. However, if the price fails to receive support, it could decrease toward 1.17200 to seek support. Additionally, if the price breaks below these levels and 1.16160 does not provide support, it could move toward the 1.15320 level for support; but if this level also fails to support, then it could decrease further to reach targets at 1.14950, 1.13540–1.13750, and 1.13150–1.12890.
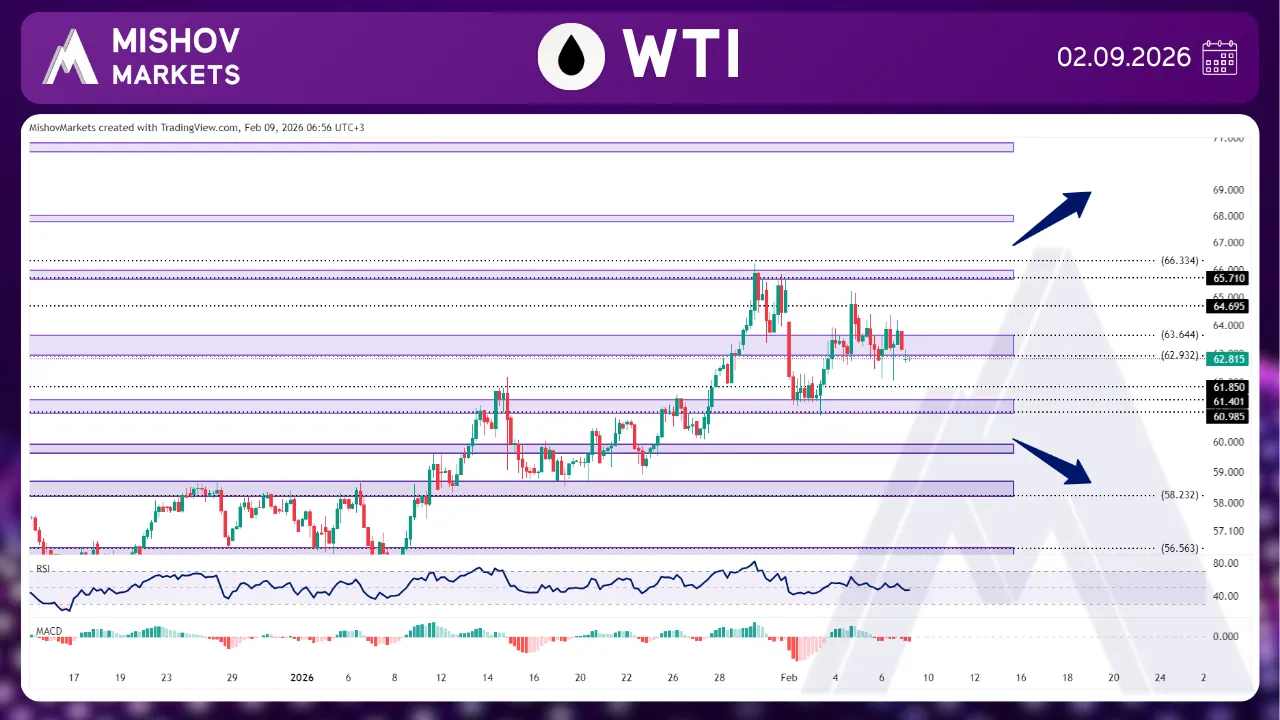
In WTI, as precisely mentioned in Wednesday's analysis, the price broke above 62.900-63.350 and reached our target at 64.690, then it faced resistance and started to decrease toward our zone at 62.900-63.350 once more. Now if the price receives support from this zone, it could increase and move toward our targets at the 64.690 and 65.710-65.980 zones; also, if it provides a close above 66.250, it may continue to move toward the ranges of 67.790-67.980, 69.100, and 70.640-70.860. However, if the 62.900-63.550 fails to support, the price could decrease further toward 61.400-60.980 and 59.930-59.600 to seek support. Furthermore, if it breaks the 58.700-58.230 zone and provides a close below 57.400, then it could decline towards the levels of 56.570-56.180, 54.630, 52.020, and 49.880.
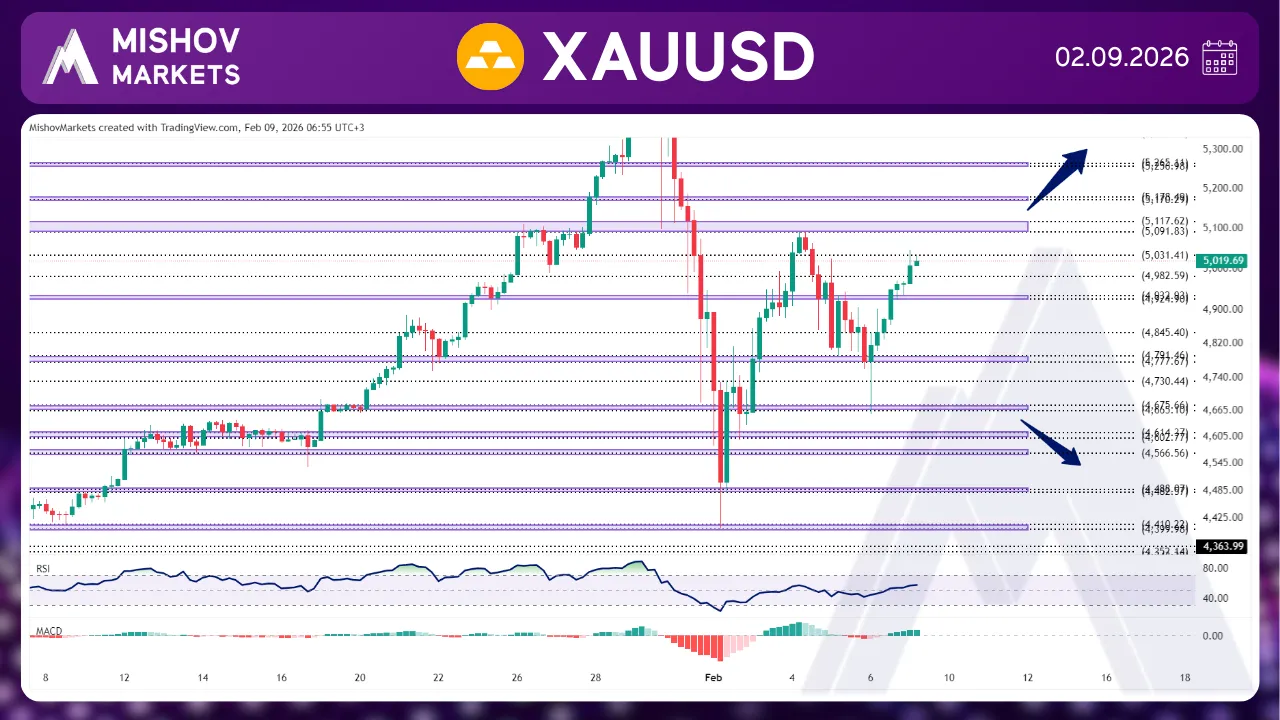
In XAUUSD, as precisely mentioned in Wednesday’s analysis, the price faced resistance in the 5091–5117 zone and began to decline, reaching all of our targets at 4982, 4933–4924, 4883, 4845, 4791–4777, 4730, and 4675–4665. Afterward, the price received support from the 4675–4665 zone and started to rise toward our targets at 4706, 4777–4791, 4845, 4883, 4924–4933, 4982, and 5031. At this stage, if the price continues to increase, it could move higher toward our next targets at 5091–5117, 5170–5178, 5256–5265, 5342–5362, 5429, 5468, and 5567. However, if the price faces resistance at the 5031 or 5091–5117 zones, it could decline once again toward the support levels at 4982, 4933–4924, 4883, 4845, 4791–4777, 4730, 4675–4665, 4614–4602, 4574–4566, and 4488–4482.
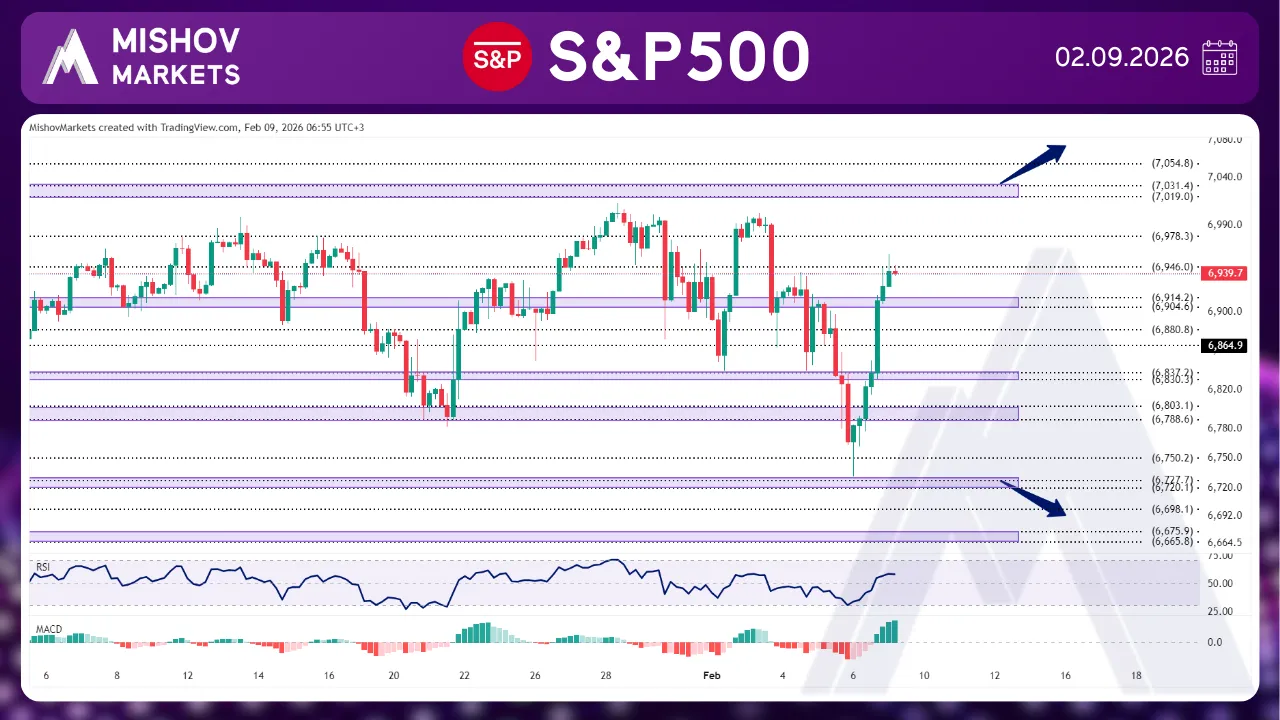
In the S&P 500, as precisely mentioned in Wednesday’s analysis, The price faced resistance and started to decrease, and after breaking below the 6830 zone with a close below 6810, it continued to move toward our targets at 6803–6788, 6785, 6750, and 6728–6720, then after receiving support from this zone, it began to rise toward our targets at 6904–6914 and 6946. At this stage, if the price continues to increase, it could move toward our next targets at 6978, 7019–7031, 7054, and 7118–7141. However, if the price faces resistance at 6946, it could decrease toward 6837-6830, 6803-6788, and 6785 to seek support. It may ultimately drop further toward 6698, 6675-6665, 6636-6625, 6611, and 6573-6564 if it breaks below the 6728-6720 zone.
