


Market Analysis 06 Aug 2025

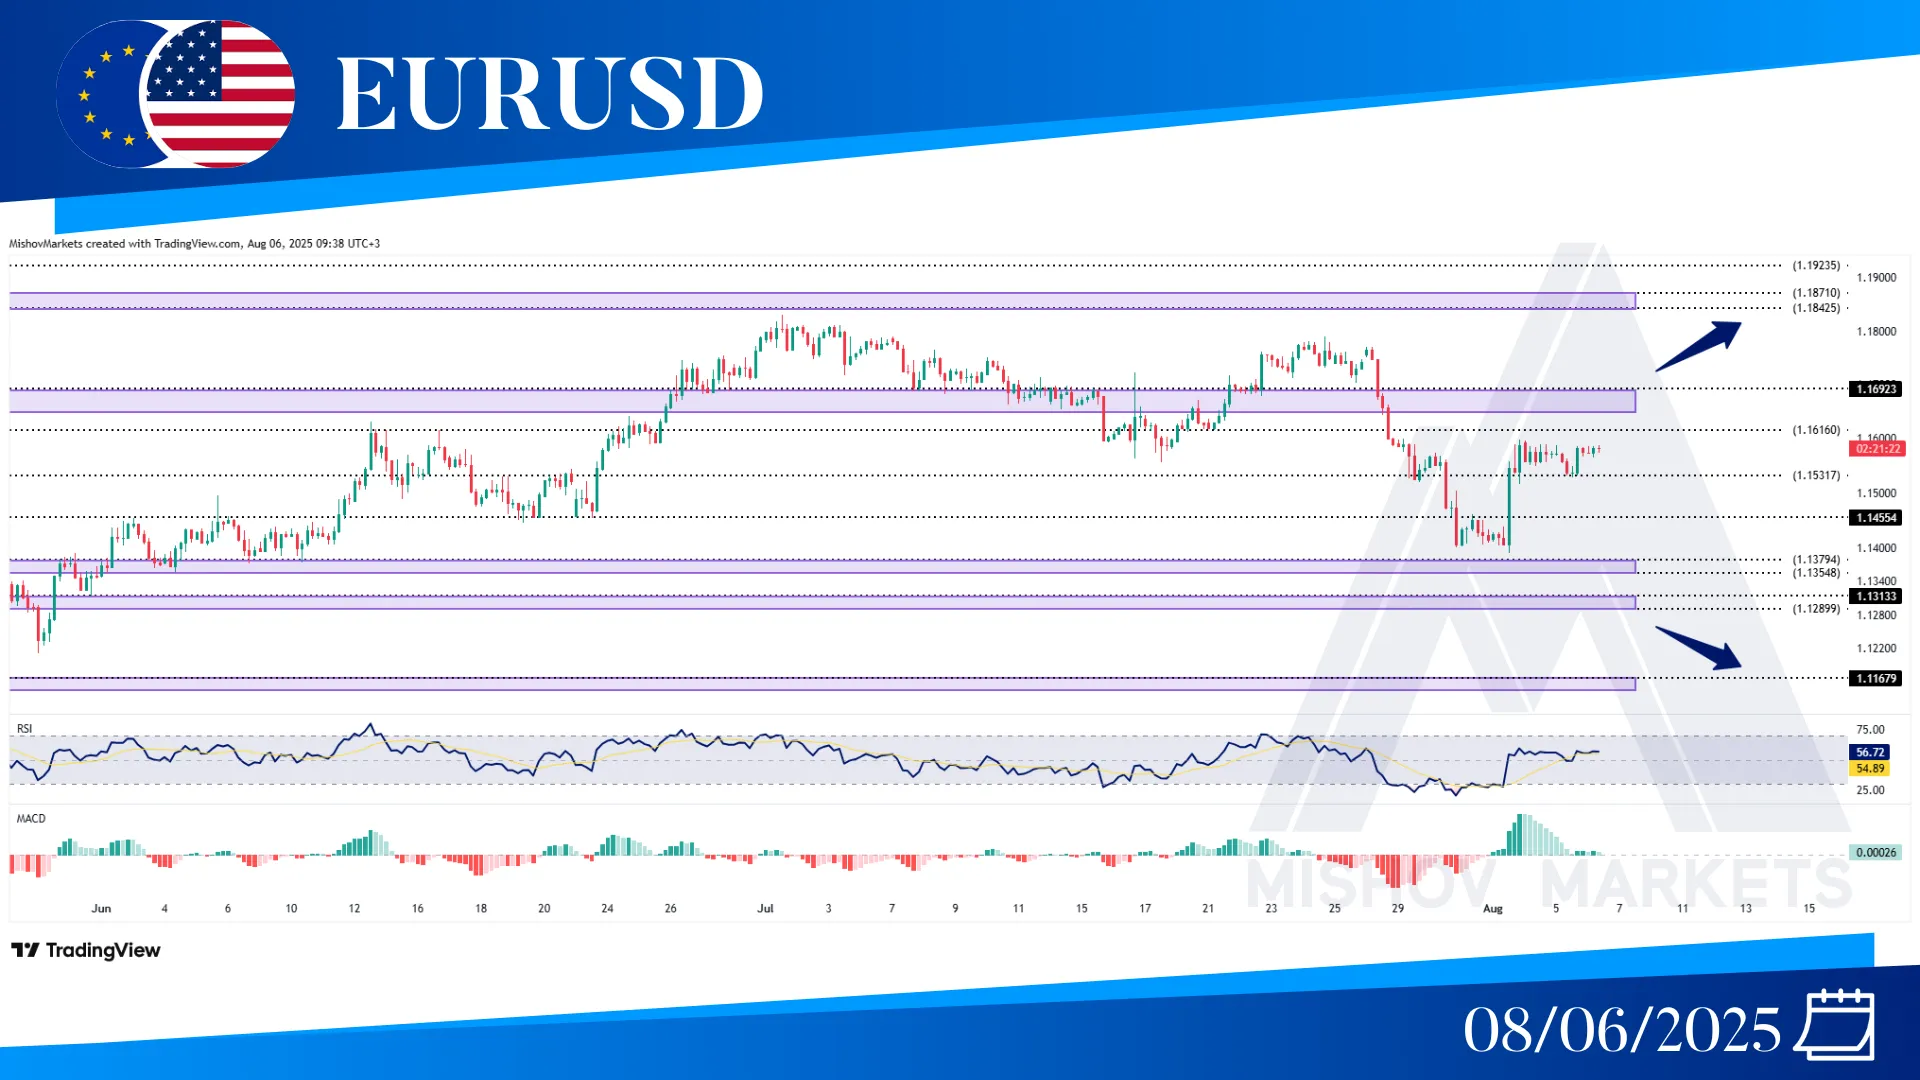
In EURUSD, as mentioned in Monday’s analysis, the situation is still the same, and the price is trading between 1.15310 and 1.16160. Now if the price breaks above 1.16160, then it could continue to reach our bullish targets at 1.16530, 1.17455, 1.18420-1.18710, 1.19230, and even 1.20040. But if it breaks below 1.15310 or if the 1.16920-1.16530 zone acts as resistance, then it could decrease toward our targets at the 1.14550 and 1.13540-1.13750 zone once more and further toward 1.13130-1.12900 and 1.11680.
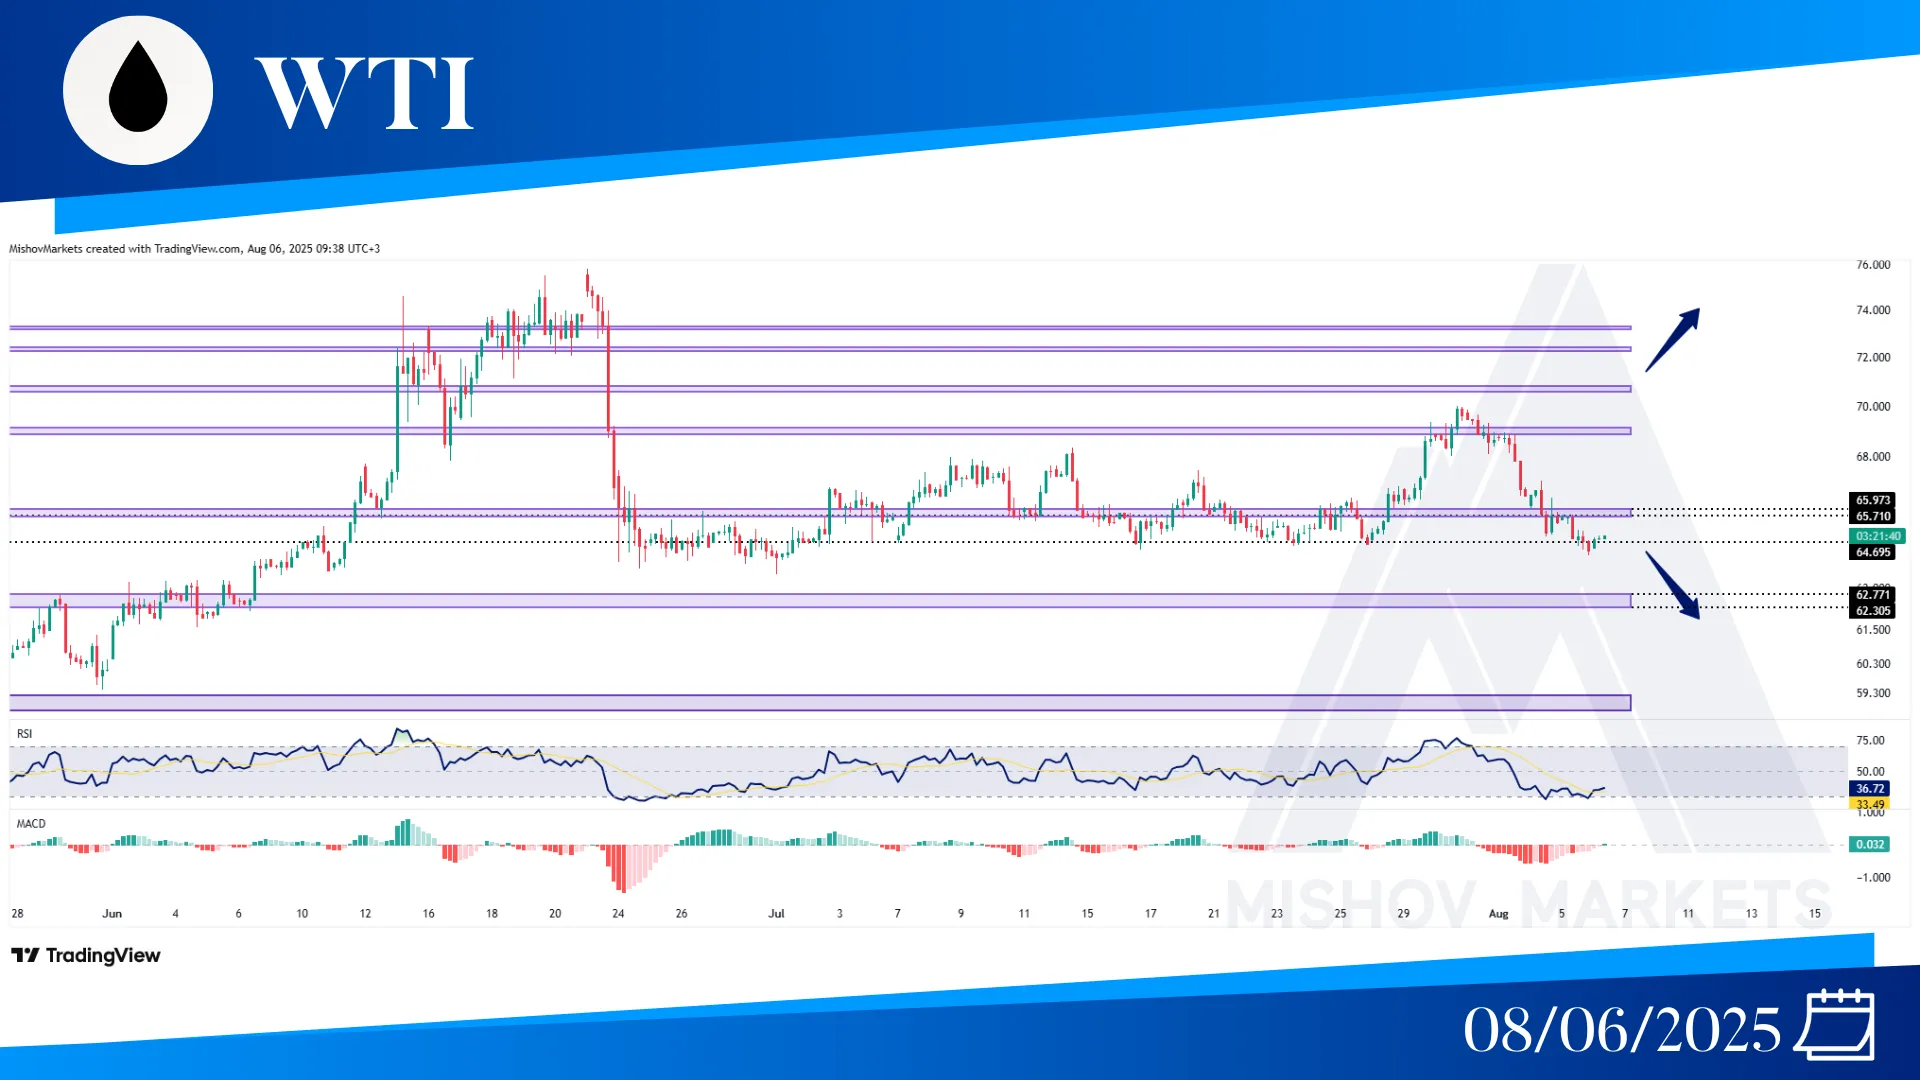
In WTI, as mentioned in Wednesday's analysis, the 65.970-65.710 zone failed to support the price, and it has moved toward our target at 64.690. Now if this zone acts as support, then it could continue to increase toward 65.970-65.710 and 69.100, and if it provides a close above the 70.000, then it could continue to move toward the 70.690 and 72.200. But if the 64.690 fails to support, and then also the 63.900 zone fails to support the price, and it provides a close below 63.400, it could decrease further toward 62.770-62.300 and 59.200-58.840.
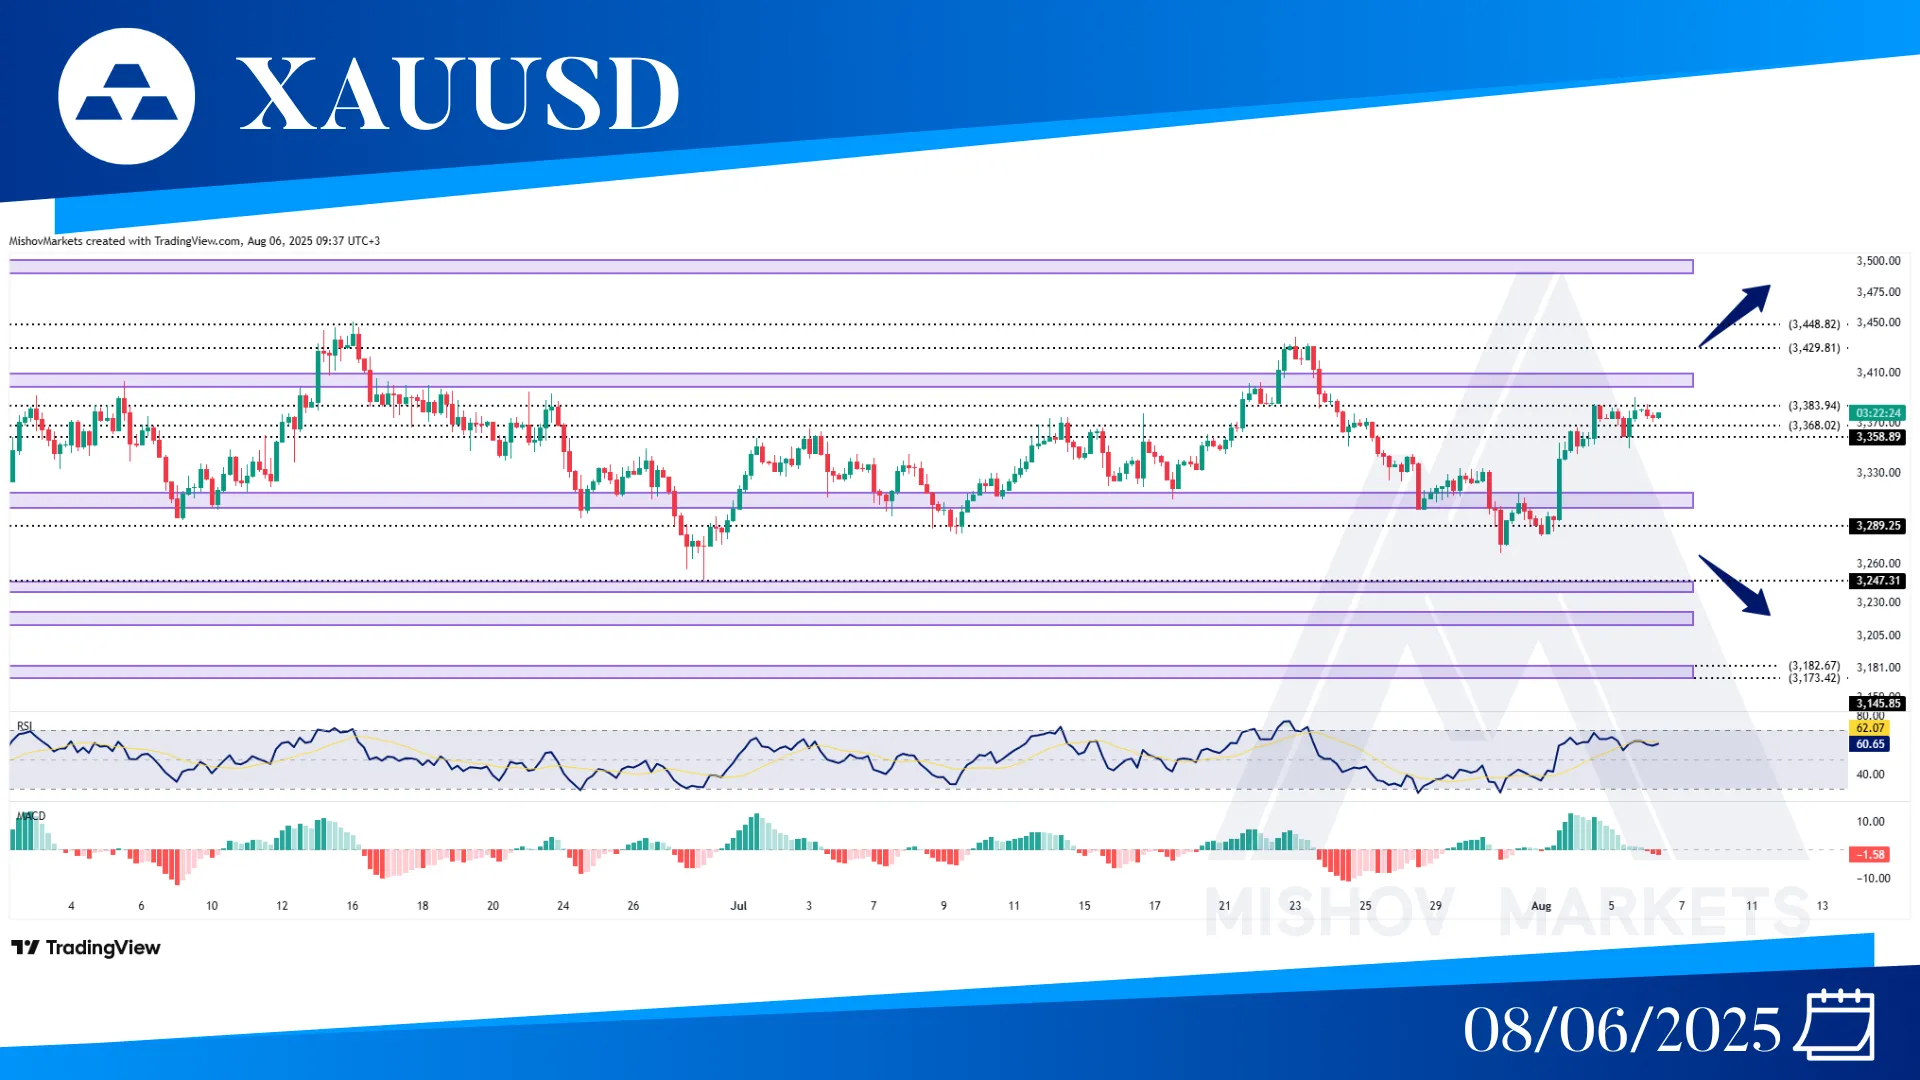
In XAUUSD, as precisely mentioned in Monday’s analysis, the price continued to increase and reached our target at 3383. The price is currently trading between 3383 and 3358 zones; if it provides a close above 3391, it may increase further toward 3398-3407, 3429, 3448, 3490-3500, and 3580. But if it starts to decrease and provide a close below 3348, then it could return to test the 3314-3305 or 3289 for support. But if these zones fail to support, then it could decrease further to 3247, 3213-3224, and 3173-3182.
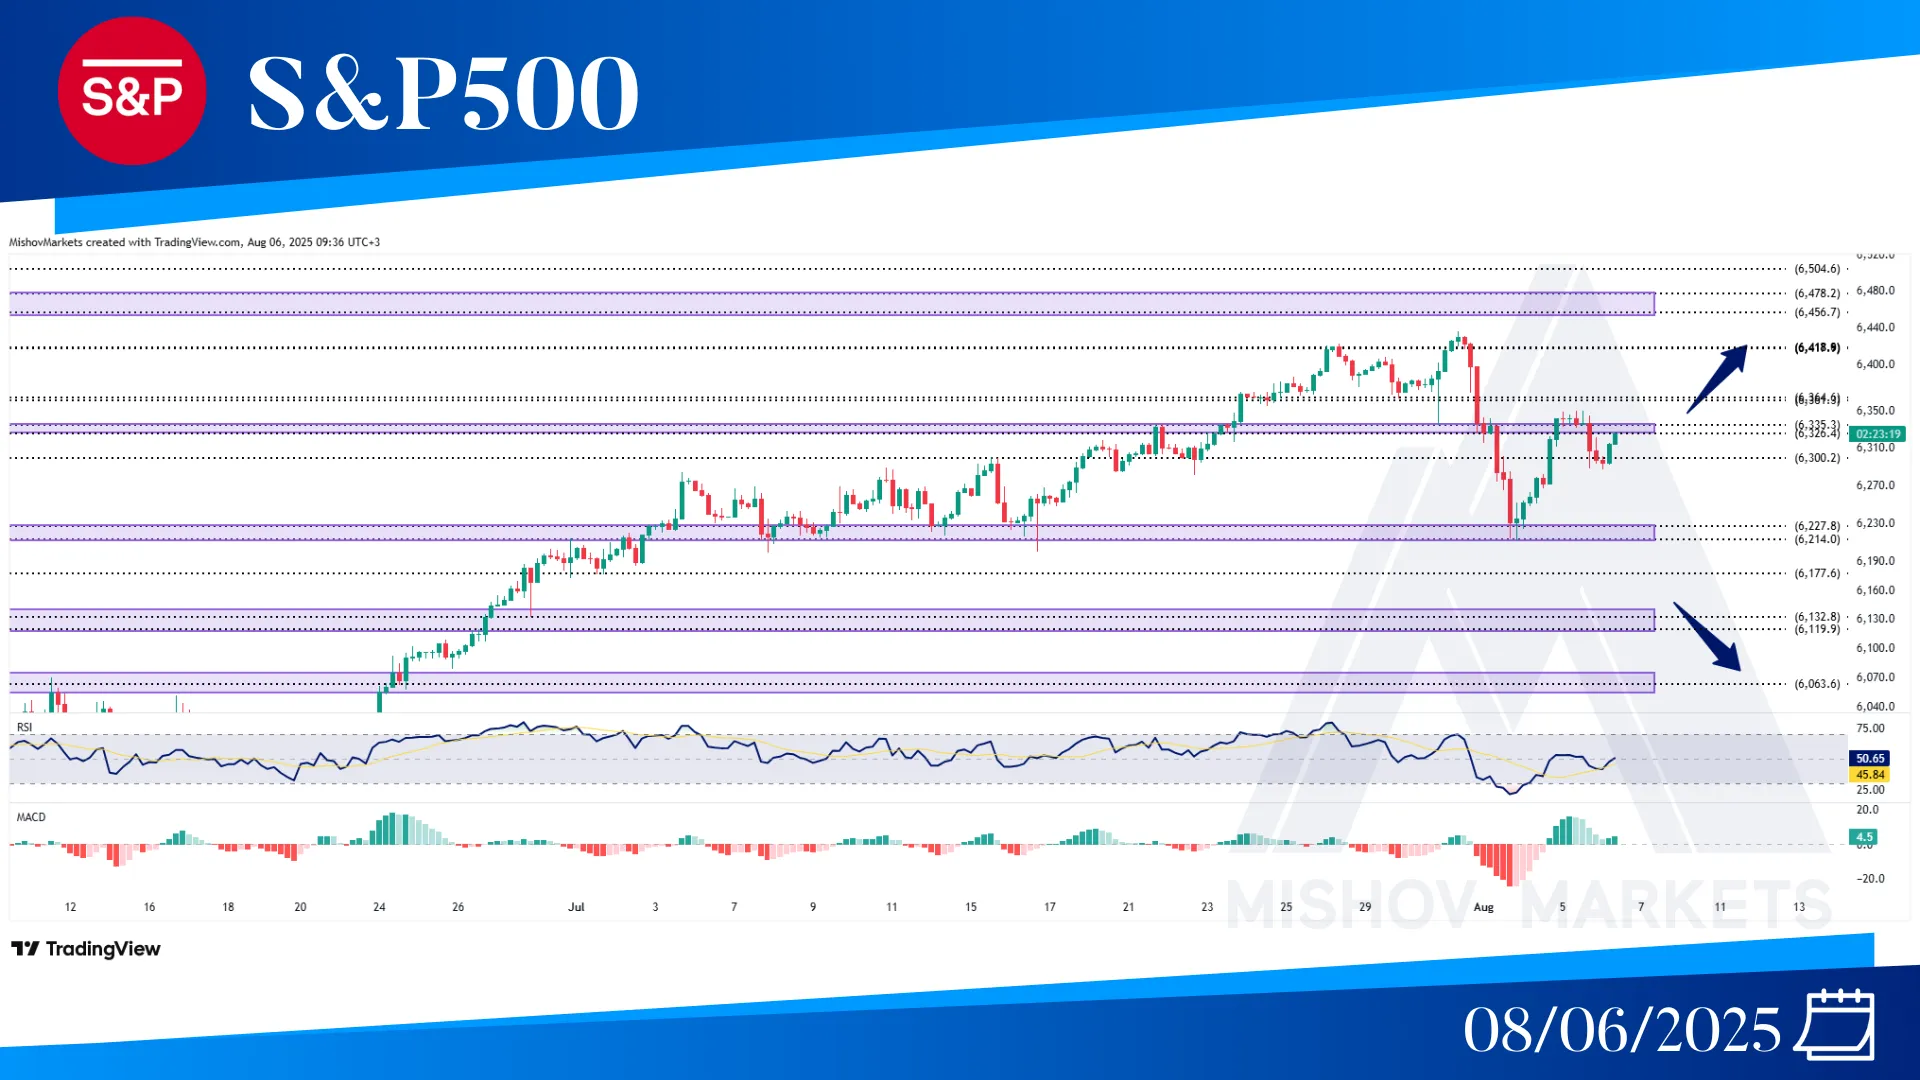
In the S&P 500, as precisely mentioned in Monday’s analysis, 6227-6214 acted as support and pushed the price toward our targets at 6300 and 6326-6335. Now if the price breaks above the 6350 zone, then it could continue to move toward 6361-6364, 6418, and 6456-6475. But if the 6326-6335 or 6361-6364 zones act as resistance, then it could decrease further toward our targets at 6227-6214, 6177, 6132-6119, 6063, and 5975.
