


Market Analysis 05 Nov 2025

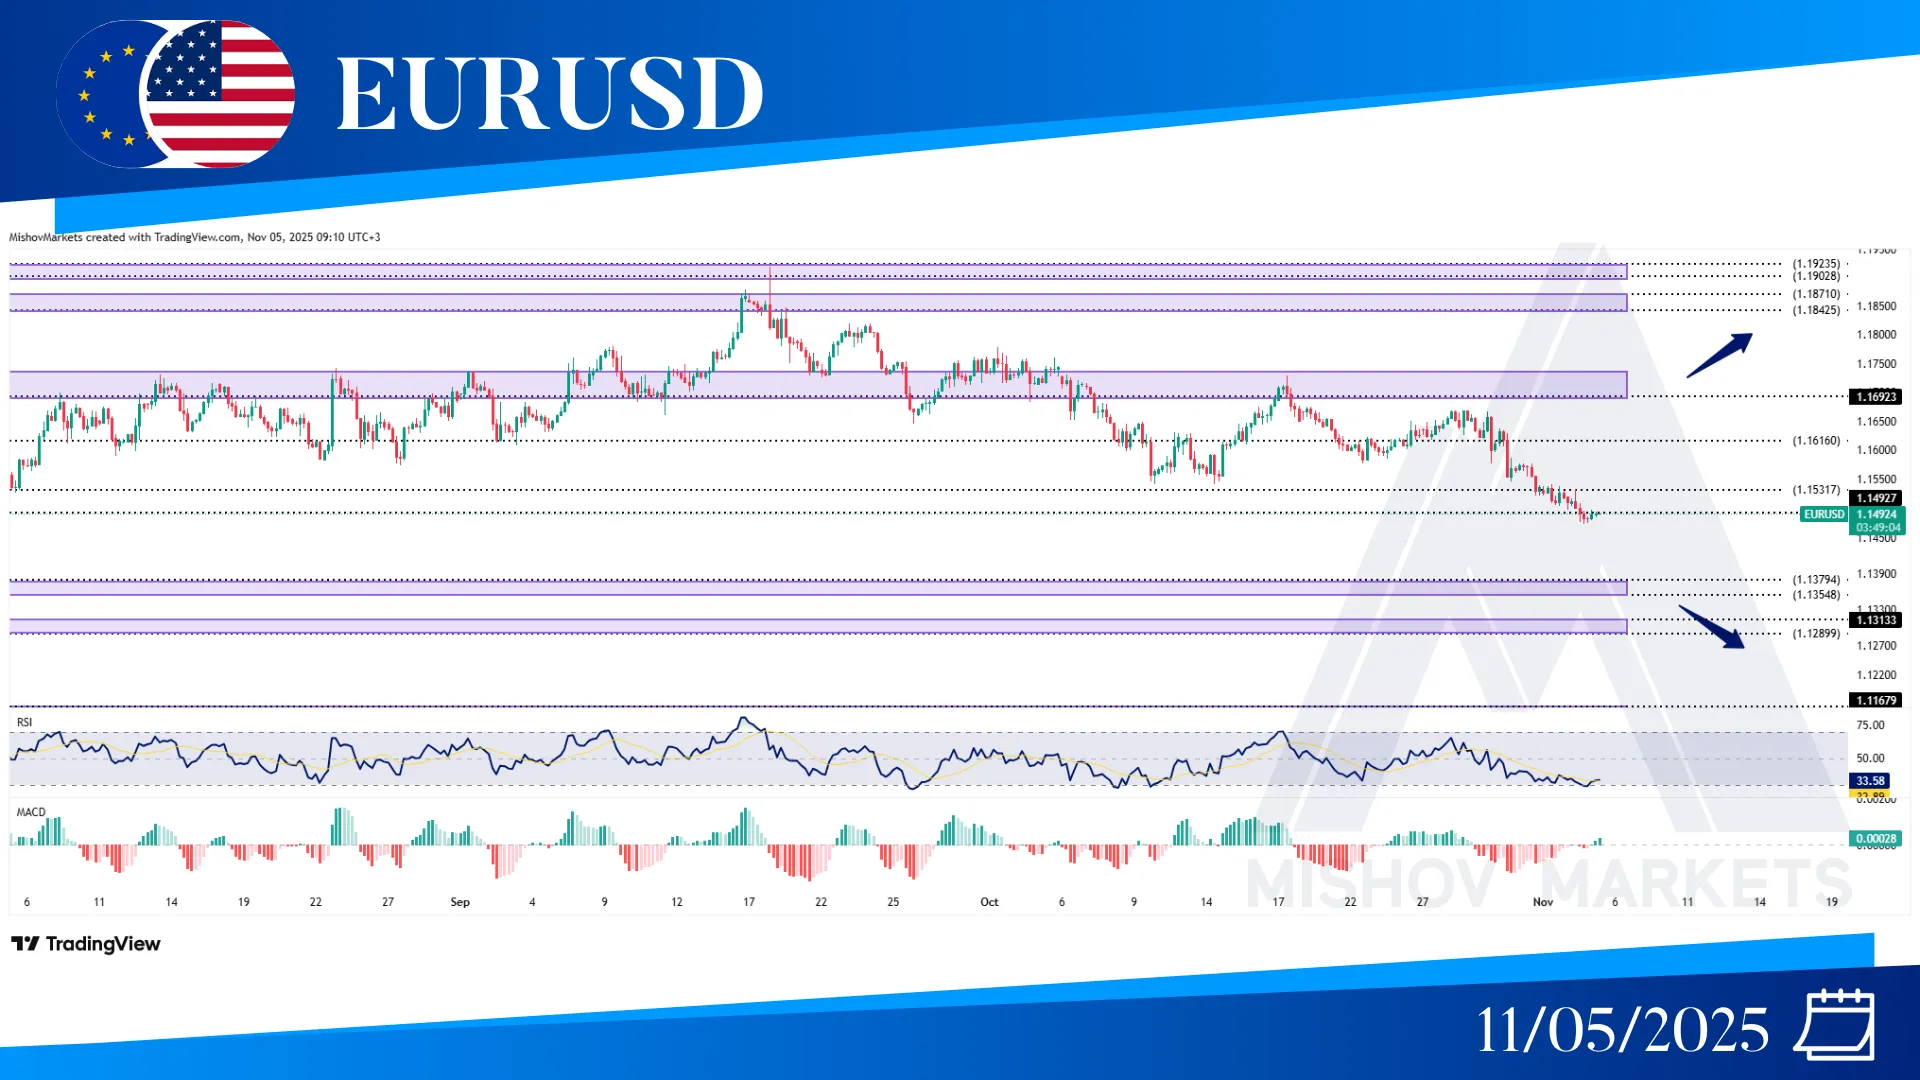
In EURUSD, as mentioned in Monday's analysis, the price has broken below 1.15310 and moved toward our target at 1.14950. Now if this zone supports the price, then it could continue to increase and start to reach our targets at 1.15310, 1.16160, 1.17300, 1.18420-1.18710, 1.19230, or possibly 1.20040. However, if the price does not find support at the 1.14550 level, it could decrease further to reach the targets in the 1.13540-1.13750 and 1.13150-1.12890 zones.
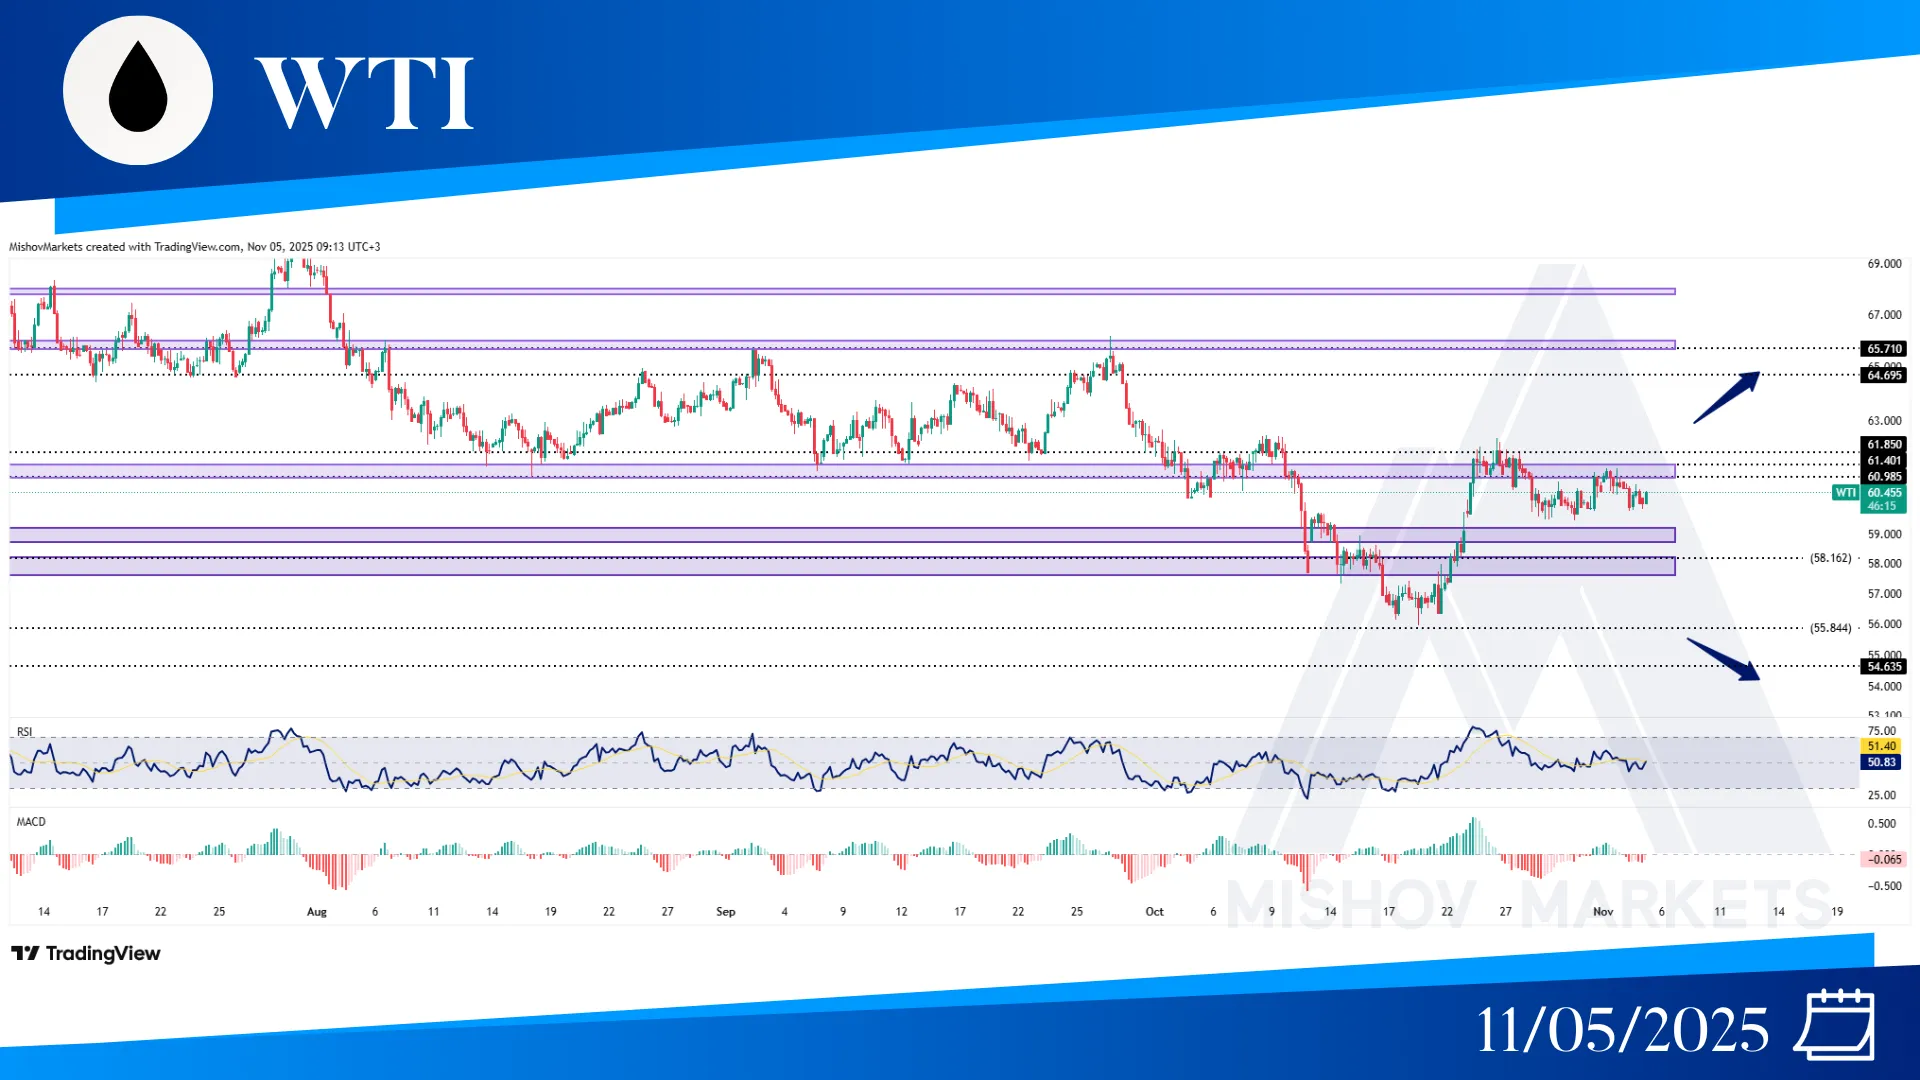
In WTI, the situation has remained unchanged since Monday's analysis and the price is consolidating between the 61.400 and 59.200 zones. Now if the price increases with a close above 62.500, then it might continue to move toward the ranges of 64.690, 65.710, 67.790-67.980 and even 69.100. But if the 59.200-58.800 zone fails to act as support, then it decreases further toward the ranges of 58.100-57.700, 55.840, 54.635 and 52.020.
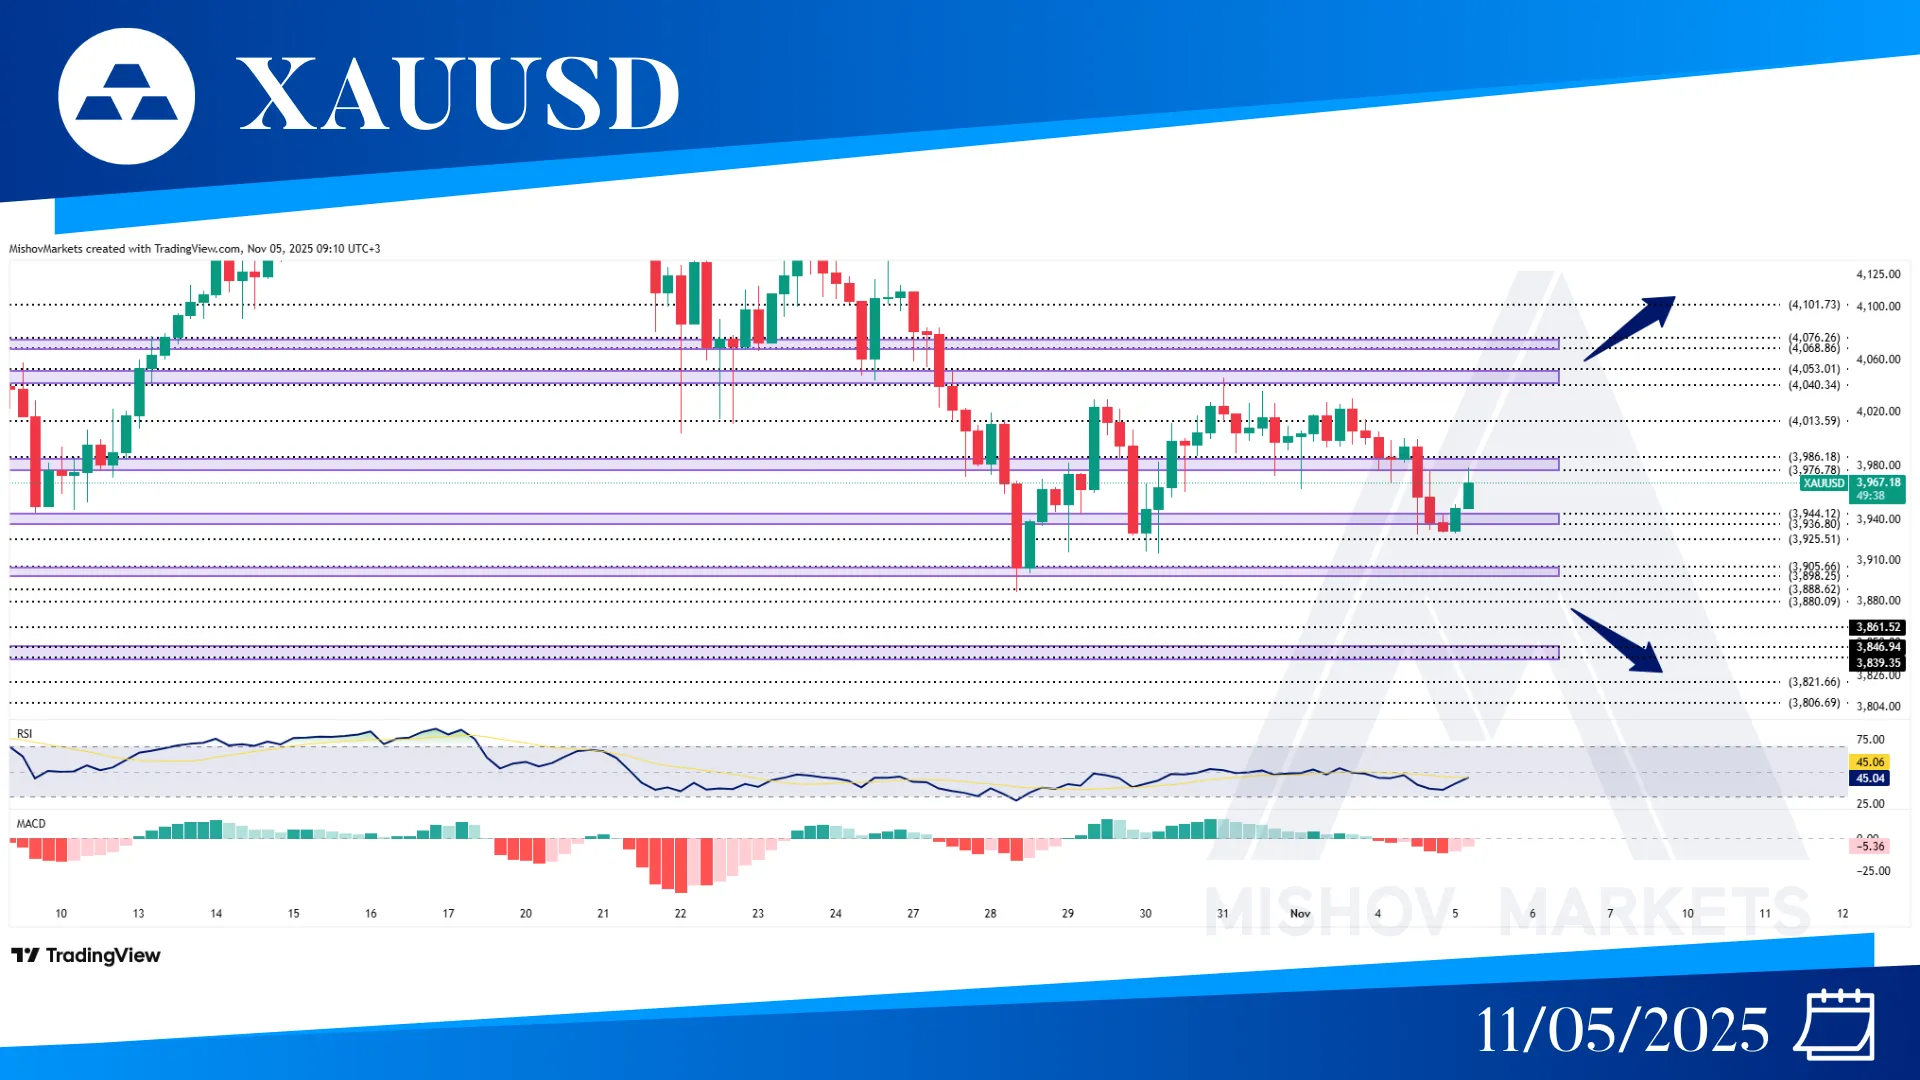
In XAUUSD, as mentioned in Monday’s analysis, the price is still trading between the range of 3925 and 4040. Now if it breaks above 4045, then it could start to increase toward 4068-4076, 4098-4101, 4143-4149, and even 4192-4205. But if it breaks below 3925, then it could continue to move toward 3880, 3861, 3846-3839, 3821, 3806-3804, and 3782.
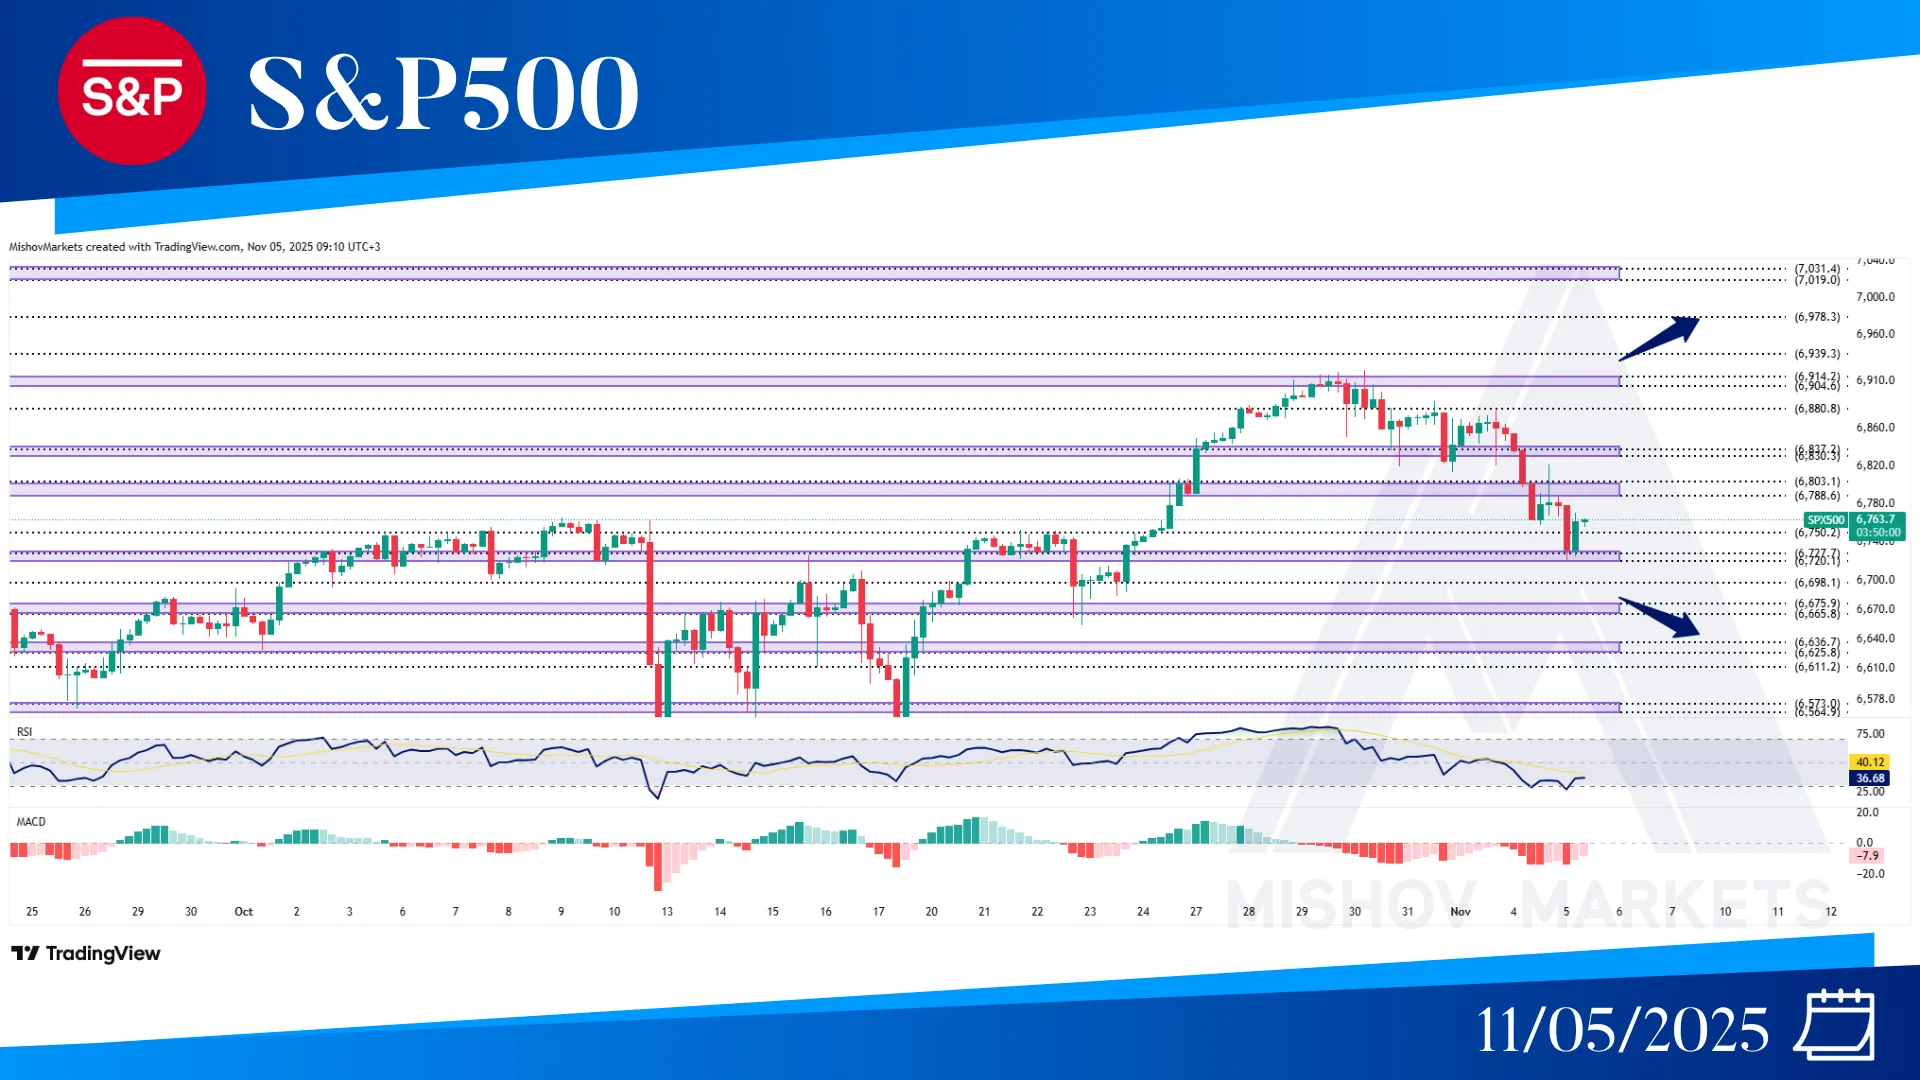
In the S&P 500, as precisely mentioned in Monday’s analysis, the 6830 zone failed to support the price, and it moved toward our targets at the 6803-6788, 6750, and 6720-6727 zones. Now if the 6720-6727 zone acts as support and continues to increase, then it could continue to reach our targets at the 6803, 6830, 6880, 6914, 6939, 6978, and 7019-7031 zones. But if the 6720 zone fails to support the price, then the price could decrease toward 6698, 6675-6665, 6636-6625, 6611, and 6573-6564.
