


Market Analysis 03 Sep 2025

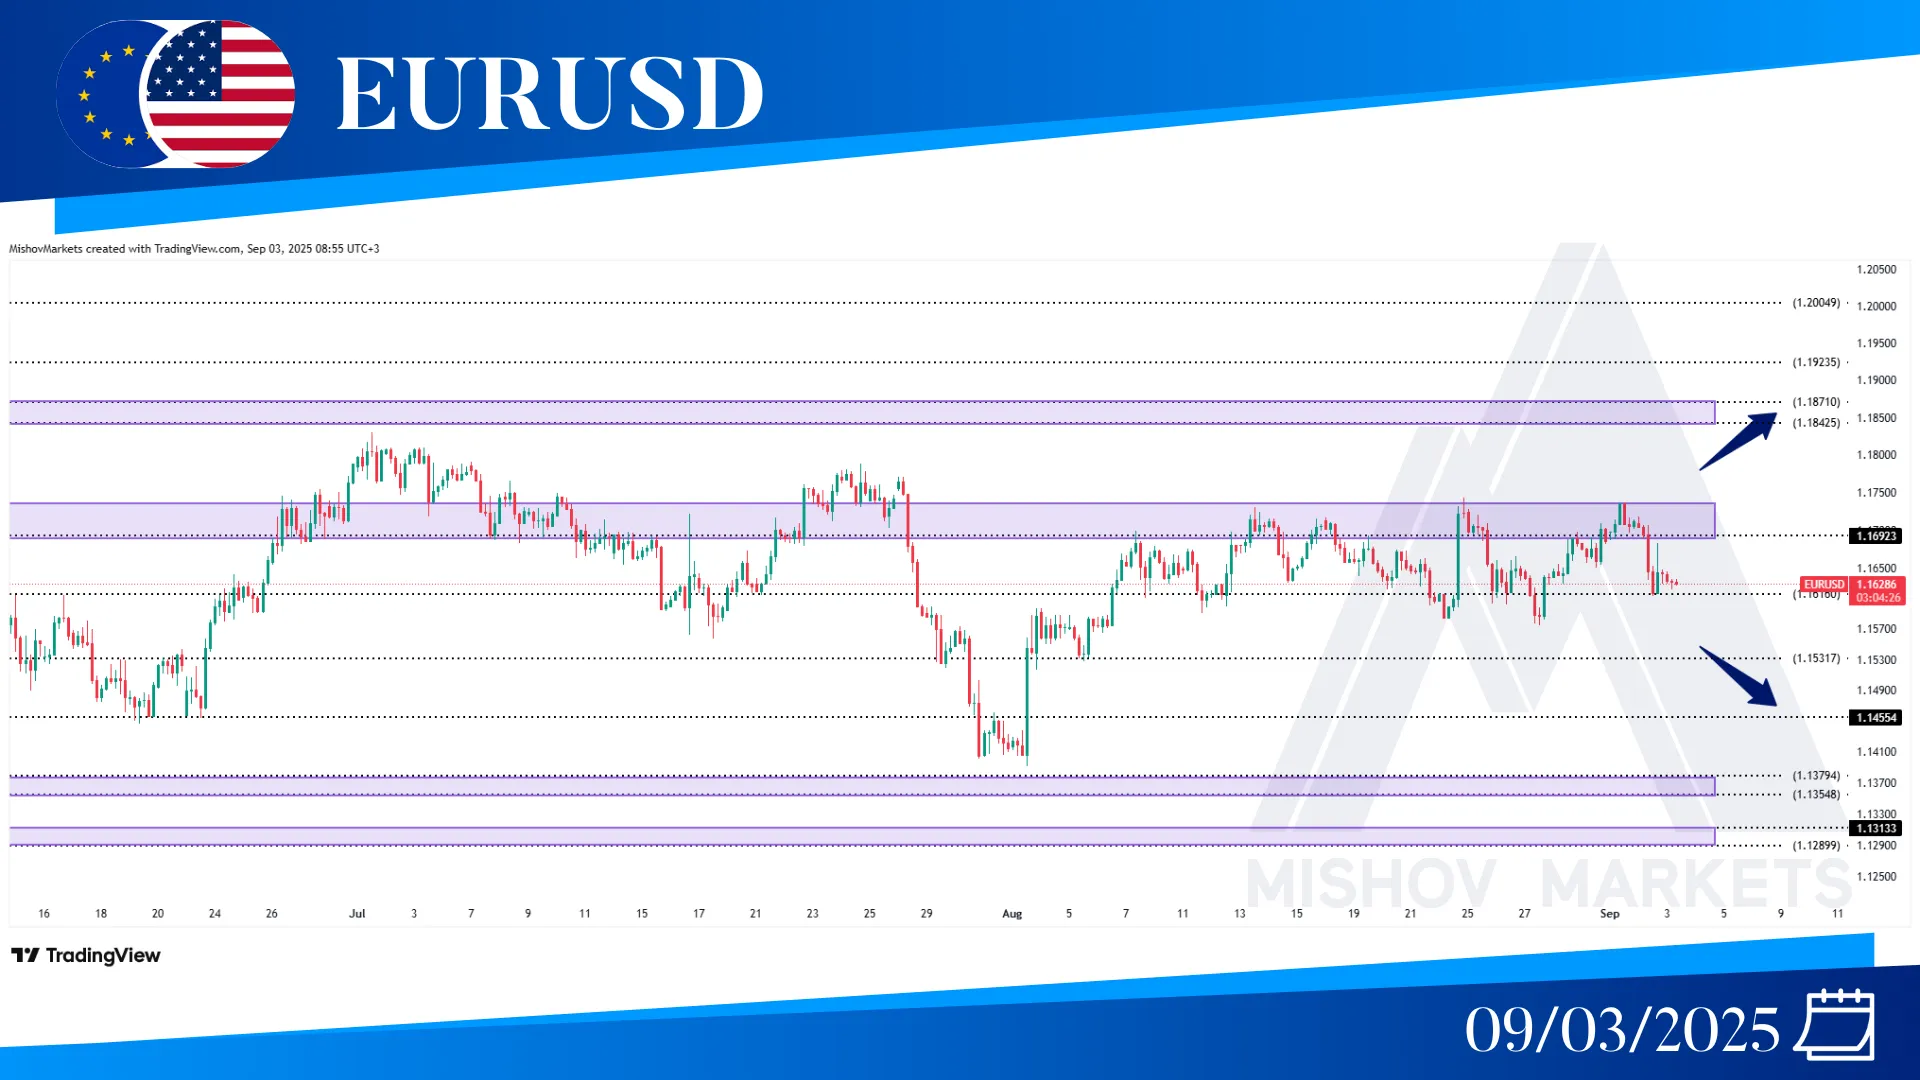
In EURUSD, the situation has remained unchanged from Monday’s analysis; the price is still trading in the same range (1.17400-1.15900) and has faced resistance at 1.17500 once more and started to decrease toward our target at 1.16160. Now If the price breaks over the 1.17500 level, it may reach 1.18420-1.18710, 1.19230, or possibly 1.20040. However, if it falls below 1.15900, it could decrease to 1.15310, and if this zone fails to hold the price, then it could decrease further toward our targets at the 1.14550 and 1.13540-1.13750 zones.
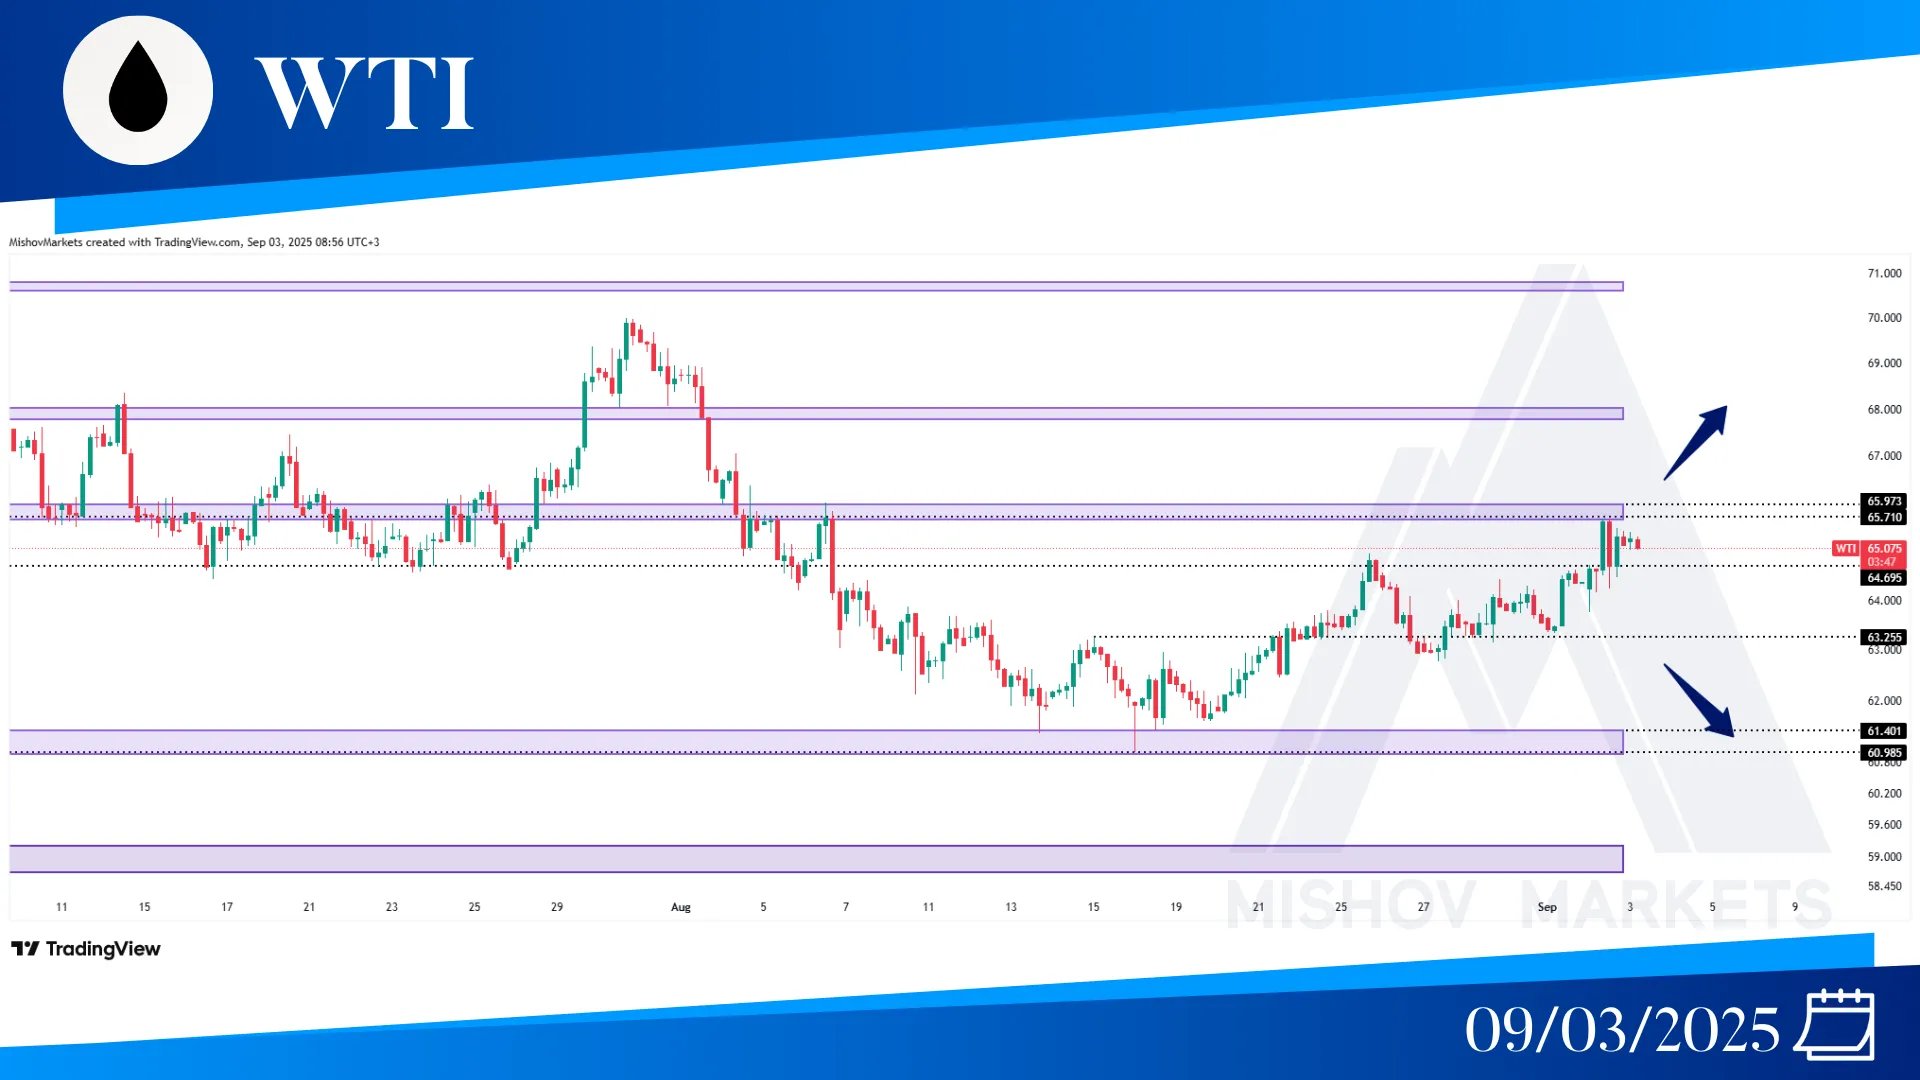
In WTI, as precisely mentioned in Monday's analysis, the price received support from 63.250 and continued to increase toward our targets at 64.690 and 65.970-65.710. Now if it breaks above the 65.710 zone with a close above 66.100, then it could continue to move toward 67.790-67.980 and 69.100. But it might face resistance from this zone and start to decrease toward 64.690 or 63.250 to receive support from them. If these zones fail to support the price, it may test the 61.400-60.990 zone for support; however, if it breaks below 60.980, it could decrease further toward the ranges of 59.200-58.840 and 57.800-58.100.
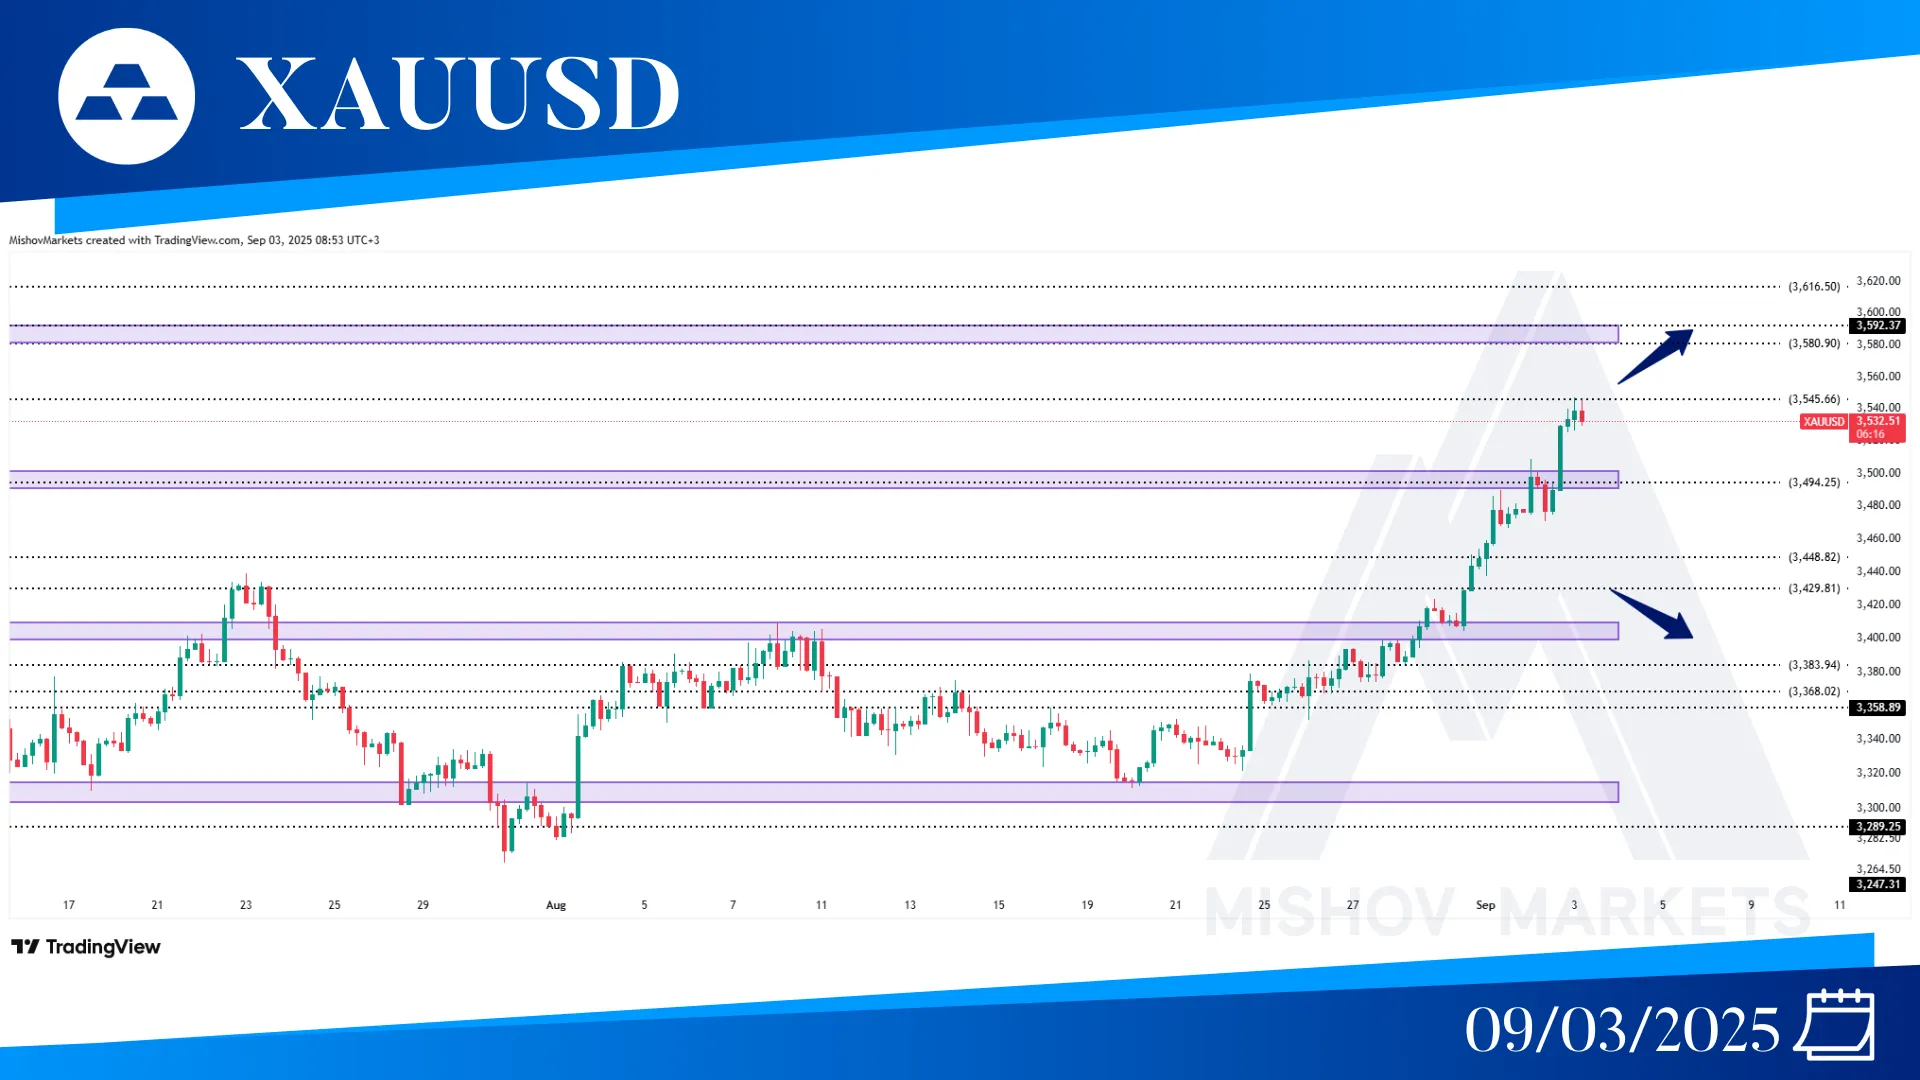
In XAUUSD, as precisely mentioned in Monday’s analysis, the price continued to increase toward our next target at 3491-3499, and after providing a close above 3500, it hit an all-time high and reached our target at 3545. Now if the price continues to increase and provides a close above 3546, then it could continue to move toward 3580-3592 and 3616. But if the 3545 zone acts as resistance, then it could start to retrace some of its movements toward 3495, 3448, 3429, and 3409-3398 to receive support from them. At this point if the 3409-3398 fails to support the price, then it could decrease further toward the 3383 and 3368 and the 3358-3350 zones.
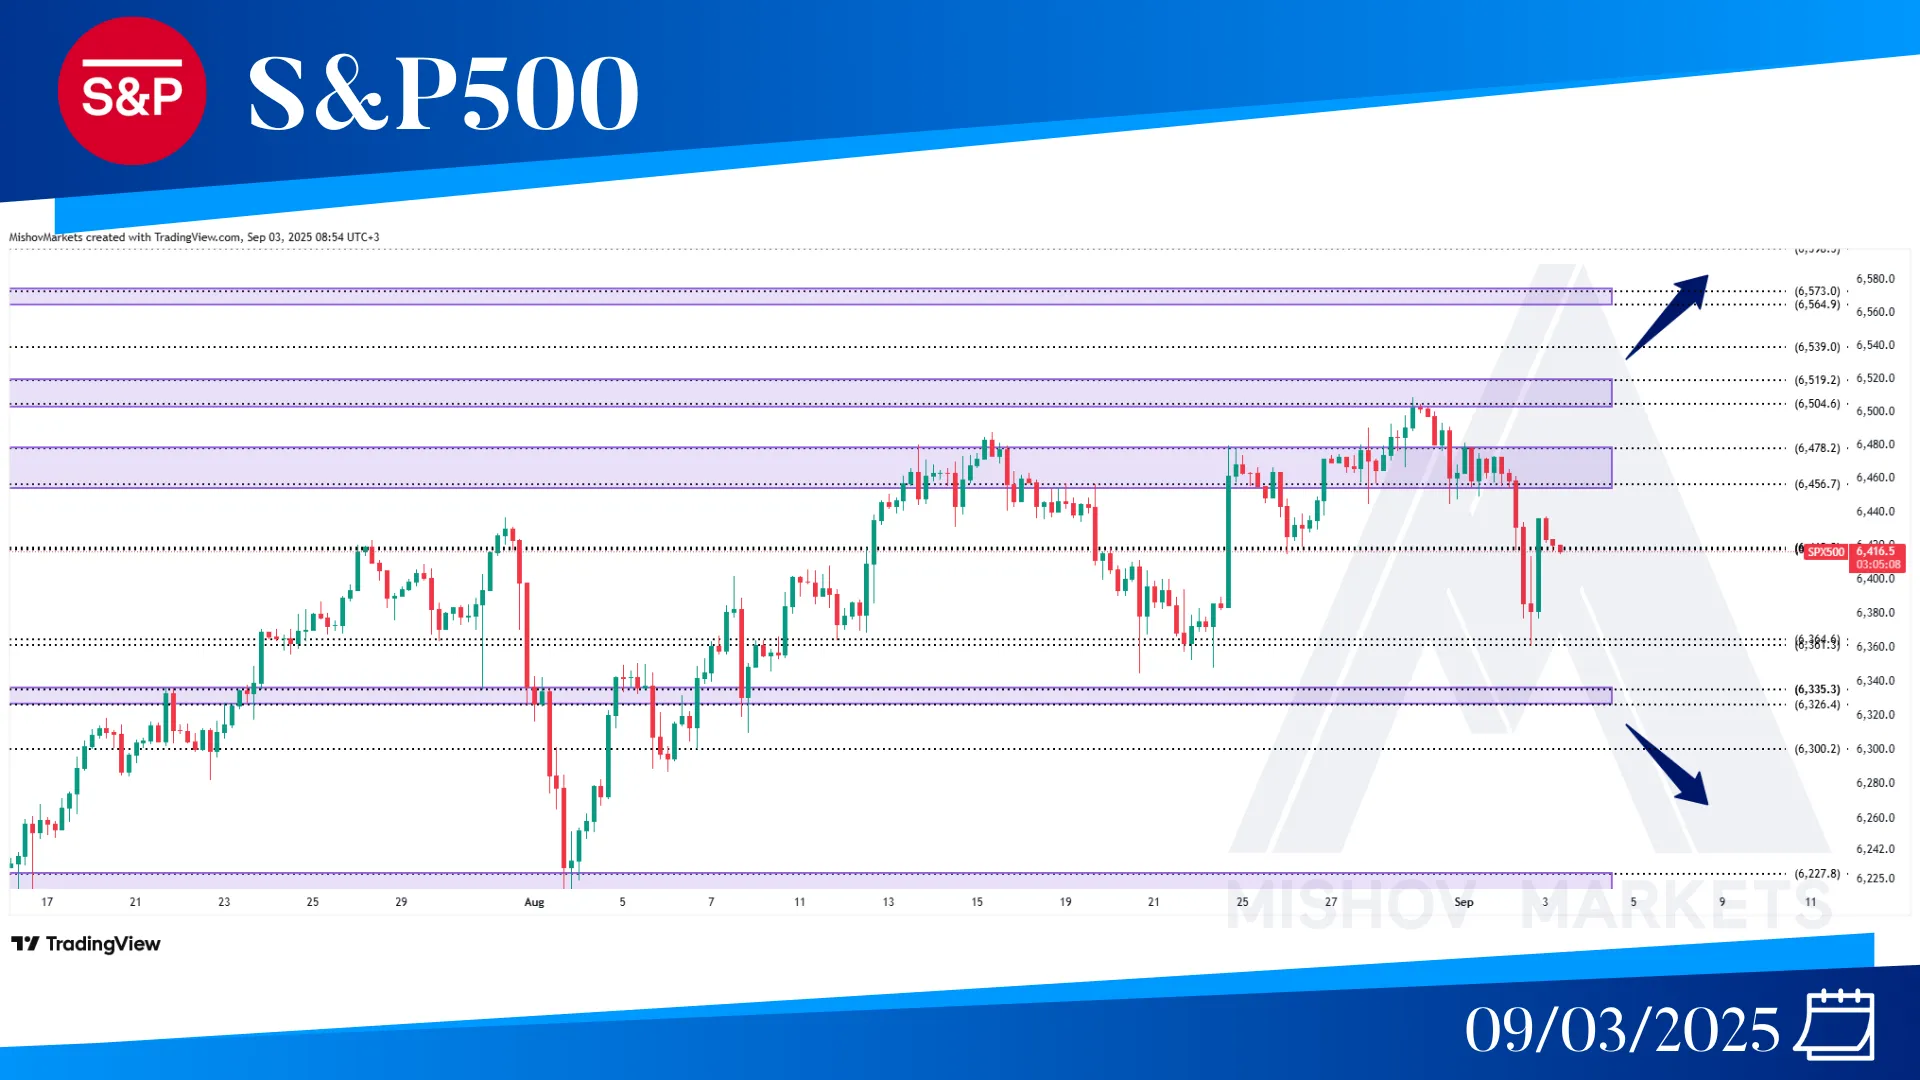
In the S&P 500, as precisely mentioned in Monday’s analysis, the price faced resistance at the 6504 zone, and as aforementioned, the 6456 zone failed to support the price and it started to decrease toward our targets at 6418 and 6361-6364 and received support from this zone. Now If the 6418 zone acts as support, then it could increase toward 6456-6478, 6504-6519, 6539, 6564-6573, and 6598. But if this zone fails to support the price, then it decreases further toward our target at 6361-6364 and 6335-6326 to receive support, but if these zones also fail to do so, then it could decrease further toward 6300, 6227-6214, 6177, and 6132-6119.
