


Market Analysis 03 Mar 2025

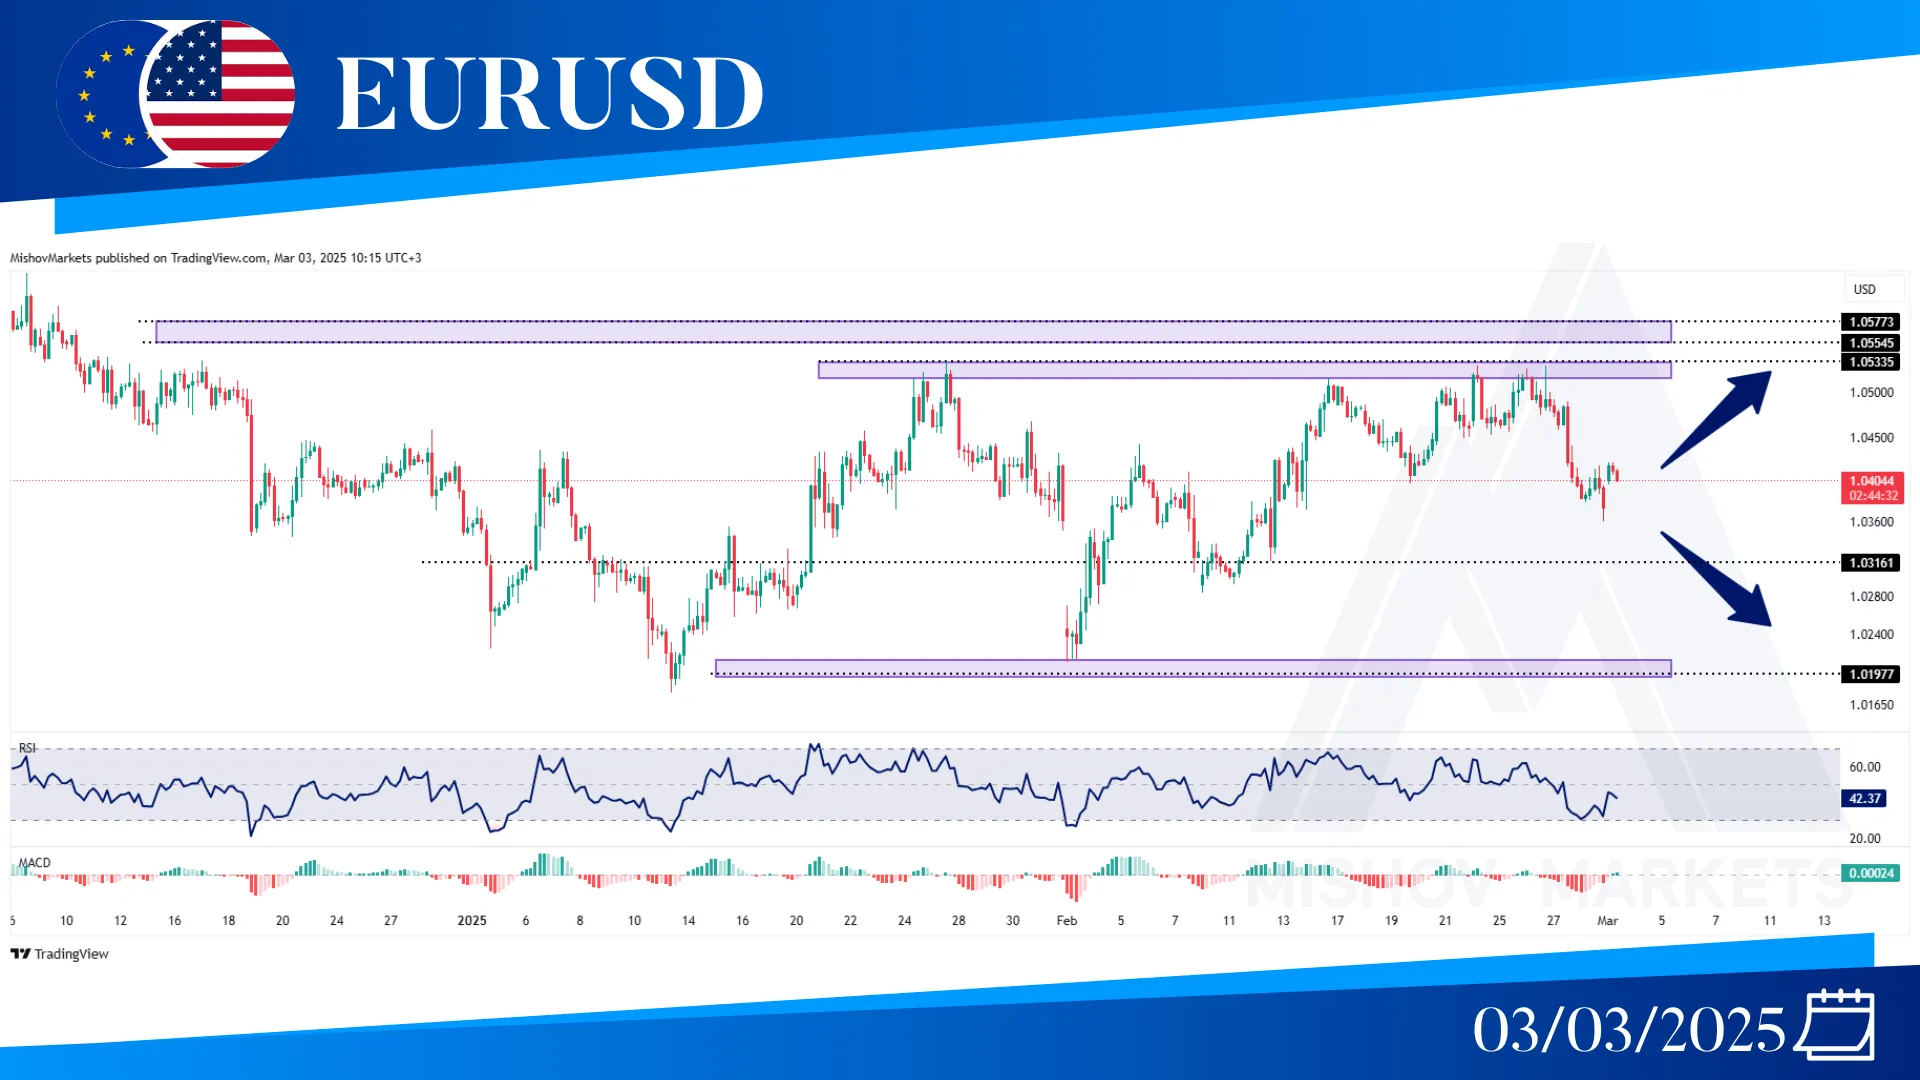
In EURUSD, as mentioned in Wednesday's analysis, the price has broken our zone (1.04770-1.04630) and is currently trading below it, so now we might wait and see price reaction to our target at 1.03160. If this level pushes the price higher, then we have to see a break above 1.05330 so we could have an eye on our bullish targets at 1.05770 and 1.06540. And if this zone fails to act as a support, the price can start to decrease toward 1.01970.
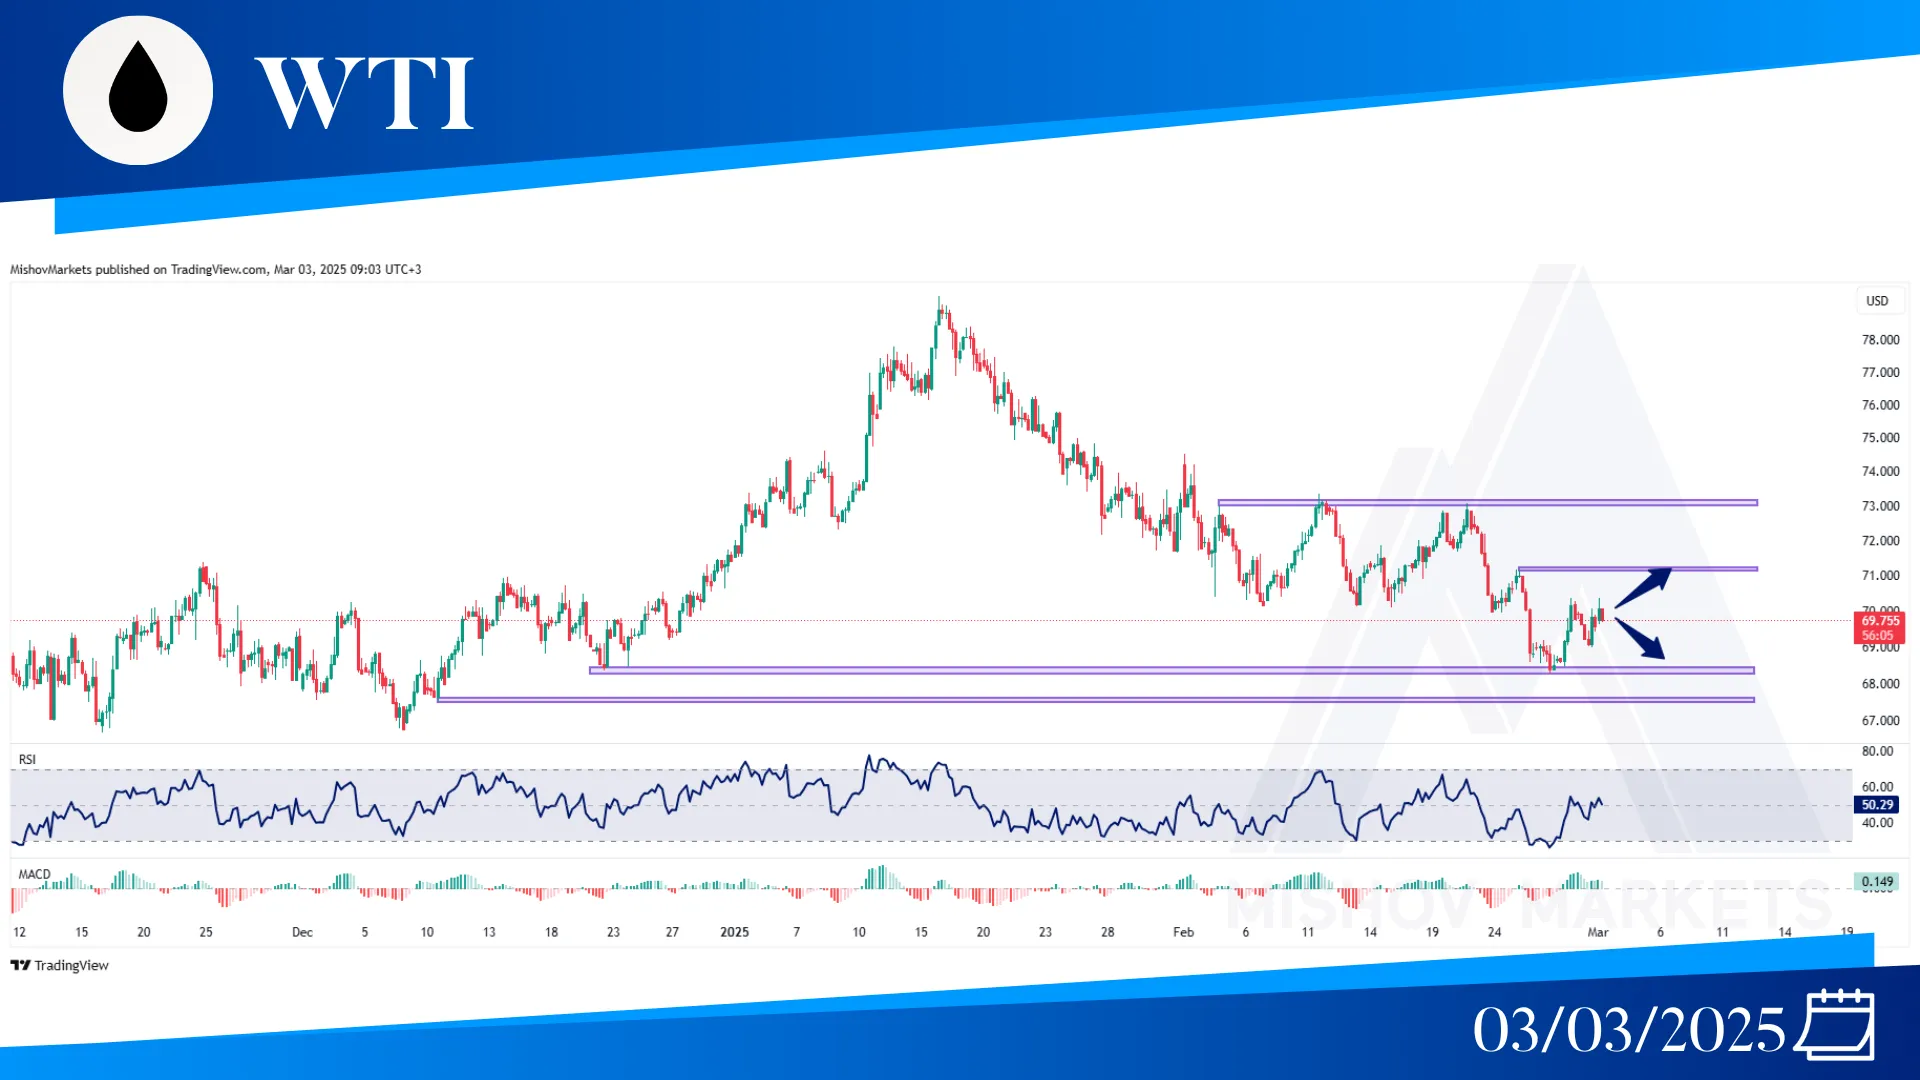
In WTI, the price has received great support from the 68.40 zone. If the price continues its upward movement and we see a close above 71.20, then we can confirm that the price has started a bullish trend and might have a target at 73.00, but if 71.20 acts as a resistance, then the price can continue its bearish movement toward 68.400 and 67.650.
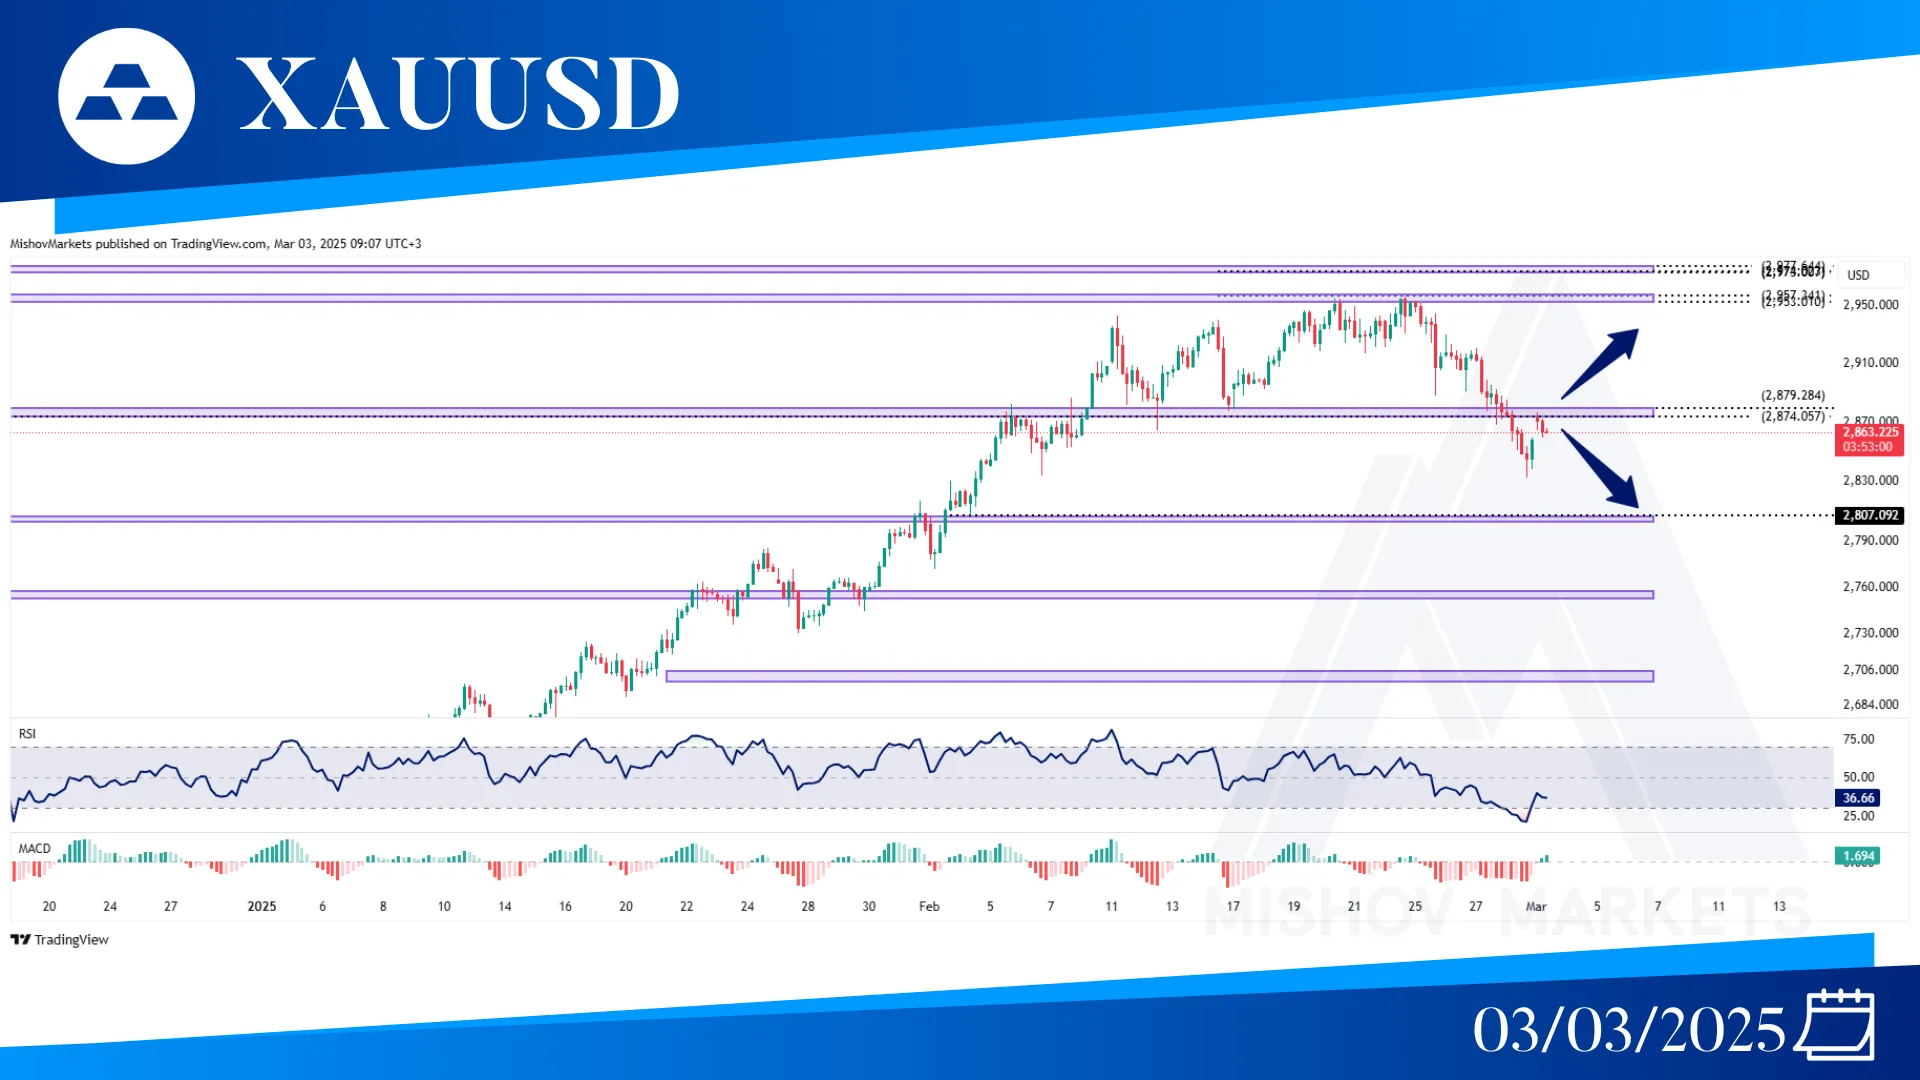
In XAUUSD, as precisely predicted in Wednesday's analysis, the price continued its bearish retracement from our (2953-2957) zone and reaching all of our targets at 2880 and 2860 as well. And we saw a close below this 2860 zone, and the price is testing our level at 2880, and we should wait and see if this zone acts as a resistance. If this zone (2874-2879) holds, then we can have eyes on 2807 as well as 2758 and lower targets. But let's not forget that the movement might be still bullish; therefore, if the price breaks above our zone, another movement toward our (2953-2957) zone and (2975-2977) can be at reach.
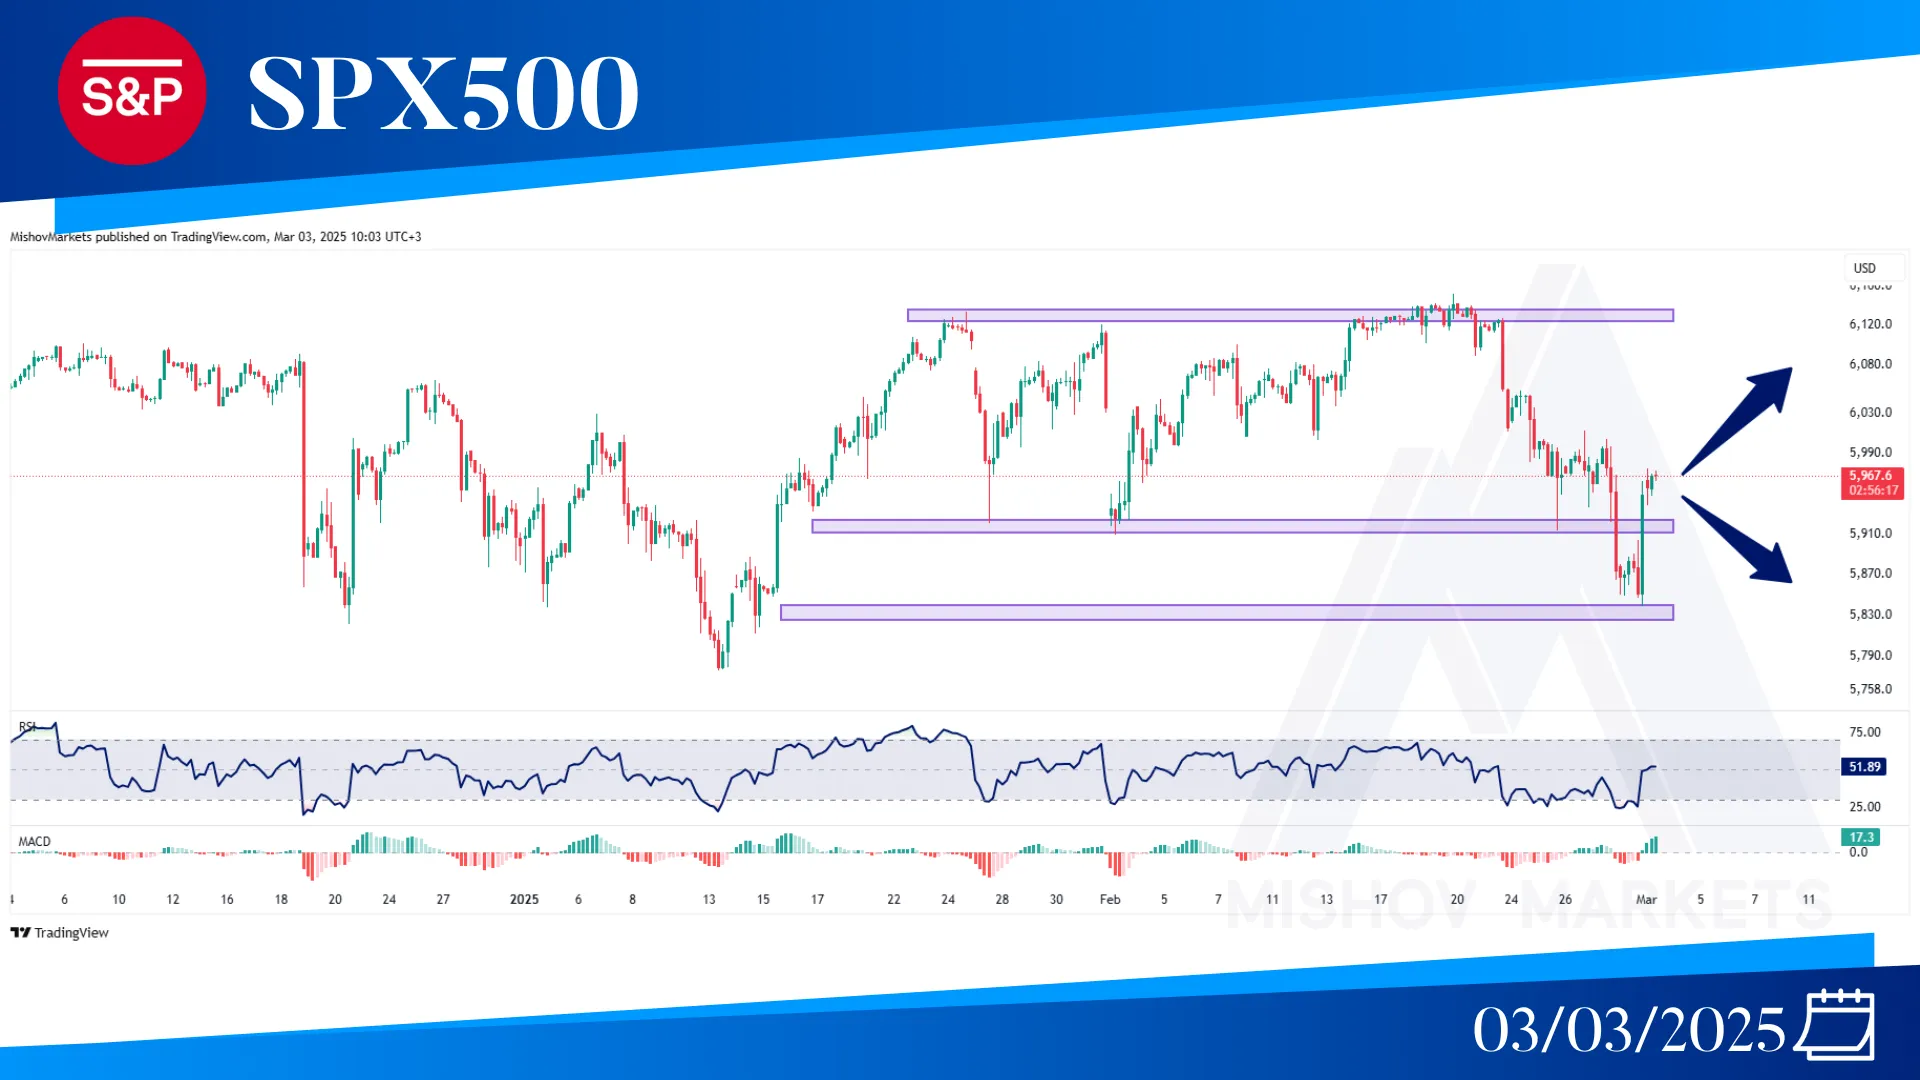
In the S&P 500, as mentioned in Wednesday’s analysis, we saw a continuum in price decline toward our target and support zone at 5840. And now the price has bounced roughly 1400 points from this support. Now if the 5920-5915 zone acts as support, then we can keep an eye on bullish movement continuity. If this zone holds as a support, we might see bullish movement toward the 6125-6134 zone and also higher highs at 6215 and 6237. But if this zone breaks, then the price can decline once more toward 5840 and also 5668.
