


Market Analysis 02 Mar 2026

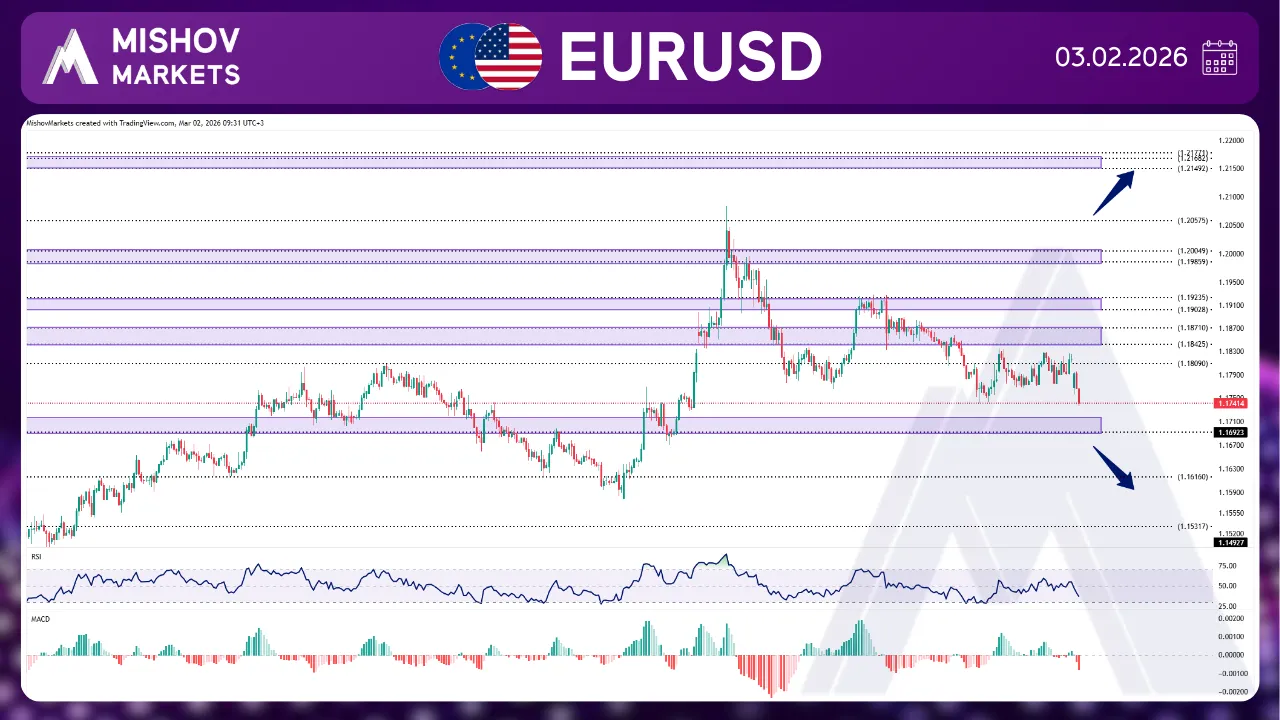
In EURUSD, as mentioned in Wednesday’s analysis. The price is trying to break below the 1.17400 and move toward the 1.17200-1.16920. If this zone supports the price, it could move toward 1.18100, 1.18420-1.18700, and 1.19020-1.19230. If the bullish momentum continues, a breakout above the 1.19020–1.19230 zone could pave the way for further upside toward 1.19850–1.20040 and 1.20570. In addition, a daily close above 1.20850 may extend the advance toward 1.21490–1.21770 and 1.23140. If the price fails to find support in the 1.17200-1.16920 range, it could lead to further downside toward 1.16160, and if it breaks this zone, downside pressure may intensify, pushing the pair toward 1.15320 and potentially lower to 1.14950, 1.13540–1.13750, and 1.13150–1.12890.
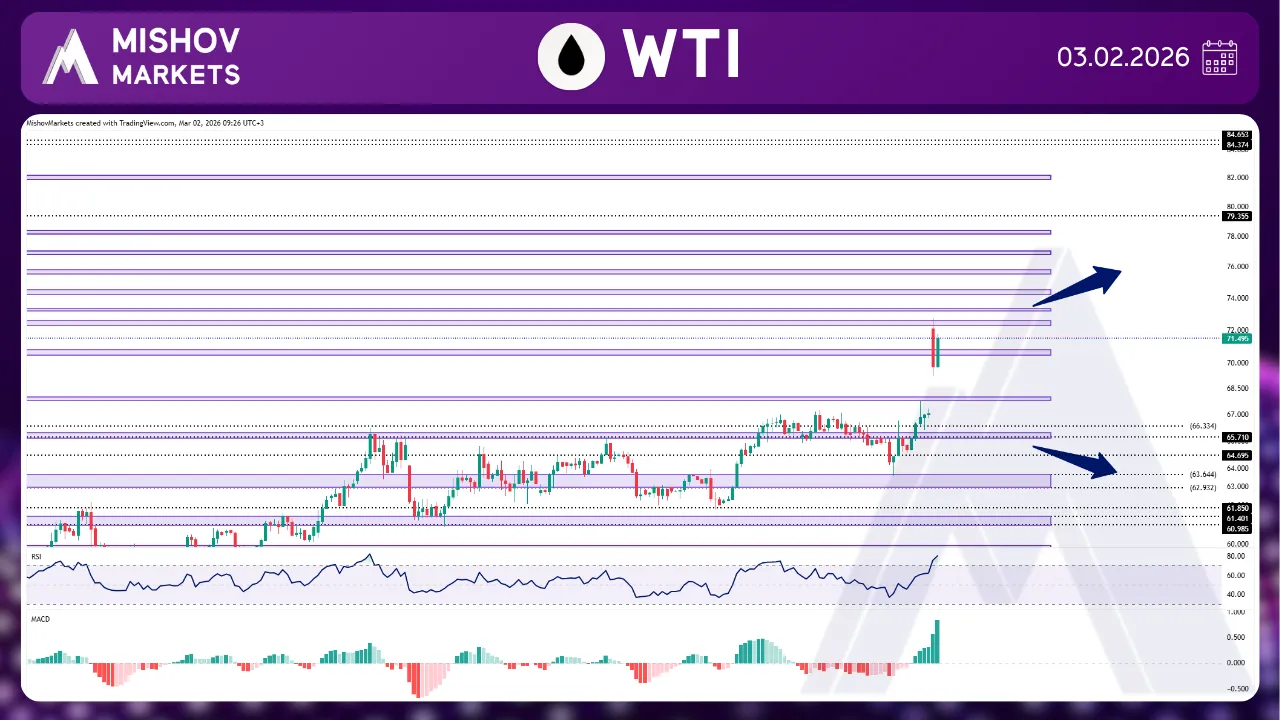
In WTI, as precisely mentioned in Wednesday’s analysis, the price initially decreased toward our target at 63.650. After receiving support from this zone, it started to increase, and following tensions in the Middle East, it soared toward all of our targets at 67.790–67.980, 69.100, 70.640–70.860, and 72.200–72.600. At this stage, if the bullish momentum remains intact with a confirmed close above 72.800, the price could extend higher toward the 73.180-73.300, 74.190-74.510, 75.540-75.780, 76.770-77.010, and 78.130-78.390 targets. On the downside, if the 72.200-72.600 zones act as resistance, the price may decline toward the 68.100-67.800 area to seek for support. Furthermore, if this zone fails to support the price, then it could break down below it and move toward 66.300, 65.700, 64.695, and 63.650-62.930.
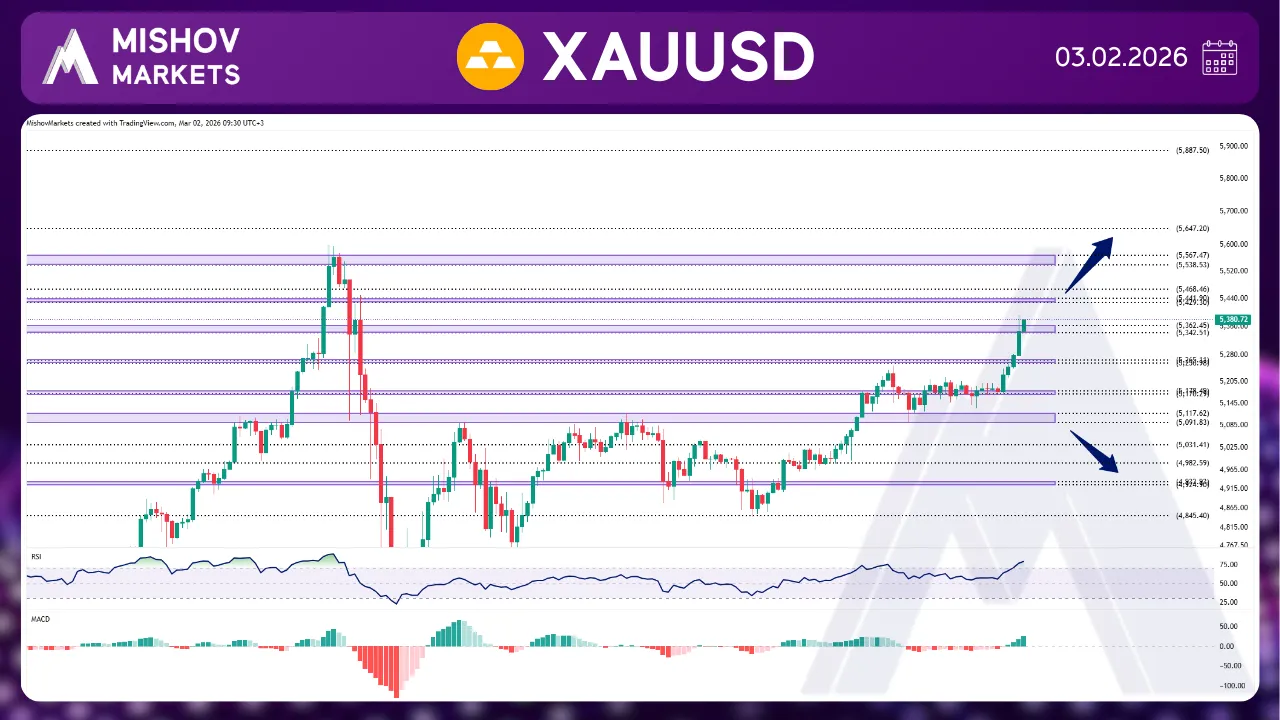
In XAUUSD, As precisely mentioned in Wednesday’s analysis, the 5178–5170 zone provided solid support, driving the price higher toward our targets at 5256–5265 and 5342–5362. At this point, if the price holds above this support area and bullish momentum continues, further upside may unfold toward the 5429–5441, 5468, 5538–5567, and 5647 levels. Conversely, if the 5429–5441 zone acts as resistance, the price could enter another corrective phase, pulling back toward 5342–5362 or 5256–5265. If these support zones fail, a deeper decline toward 5178–5170 or even the 5117–5091 area may occur. Moreover, a clear break below these levels could trigger a renewed bearish move toward lower supports at 4983, 4924–4932, 4845, 4747–4730, 4675–4665, 4614–4602, 4574–4566, and 4488–4482.
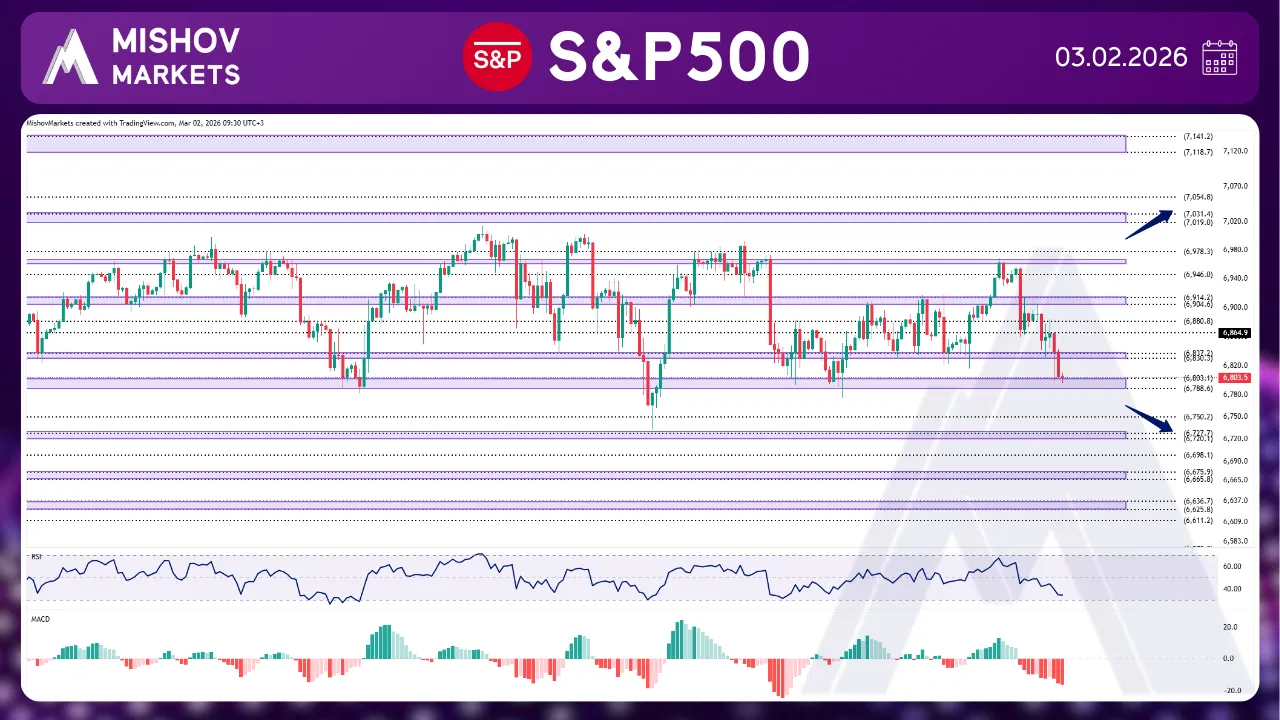
In the S&P 500, As mentioned in Wednesday’s analysis, the price moved toward our target at the 6960-6966 zone and after facing resistance at this zone, it has started to decrease, reaching our targets at the 6914, 6880, 6830, and 6803-6788 zones. At this point, if the 6803–6788 zones fail to hold as support, and it provides a close below the 6770, the price could move toward the 6727–6720 area, and if it breaks below this zone as well, it may lead to deeper losses toward 6698, 6675–6665, 6636–6625, 6611, and 6573–6564. Conversely, if the price receives support from the 6727-6720 zone, it could increase toward our targets at 6803-6788, 6830, and 6914 once more.
