


Market Analysis 02 Jul 2025

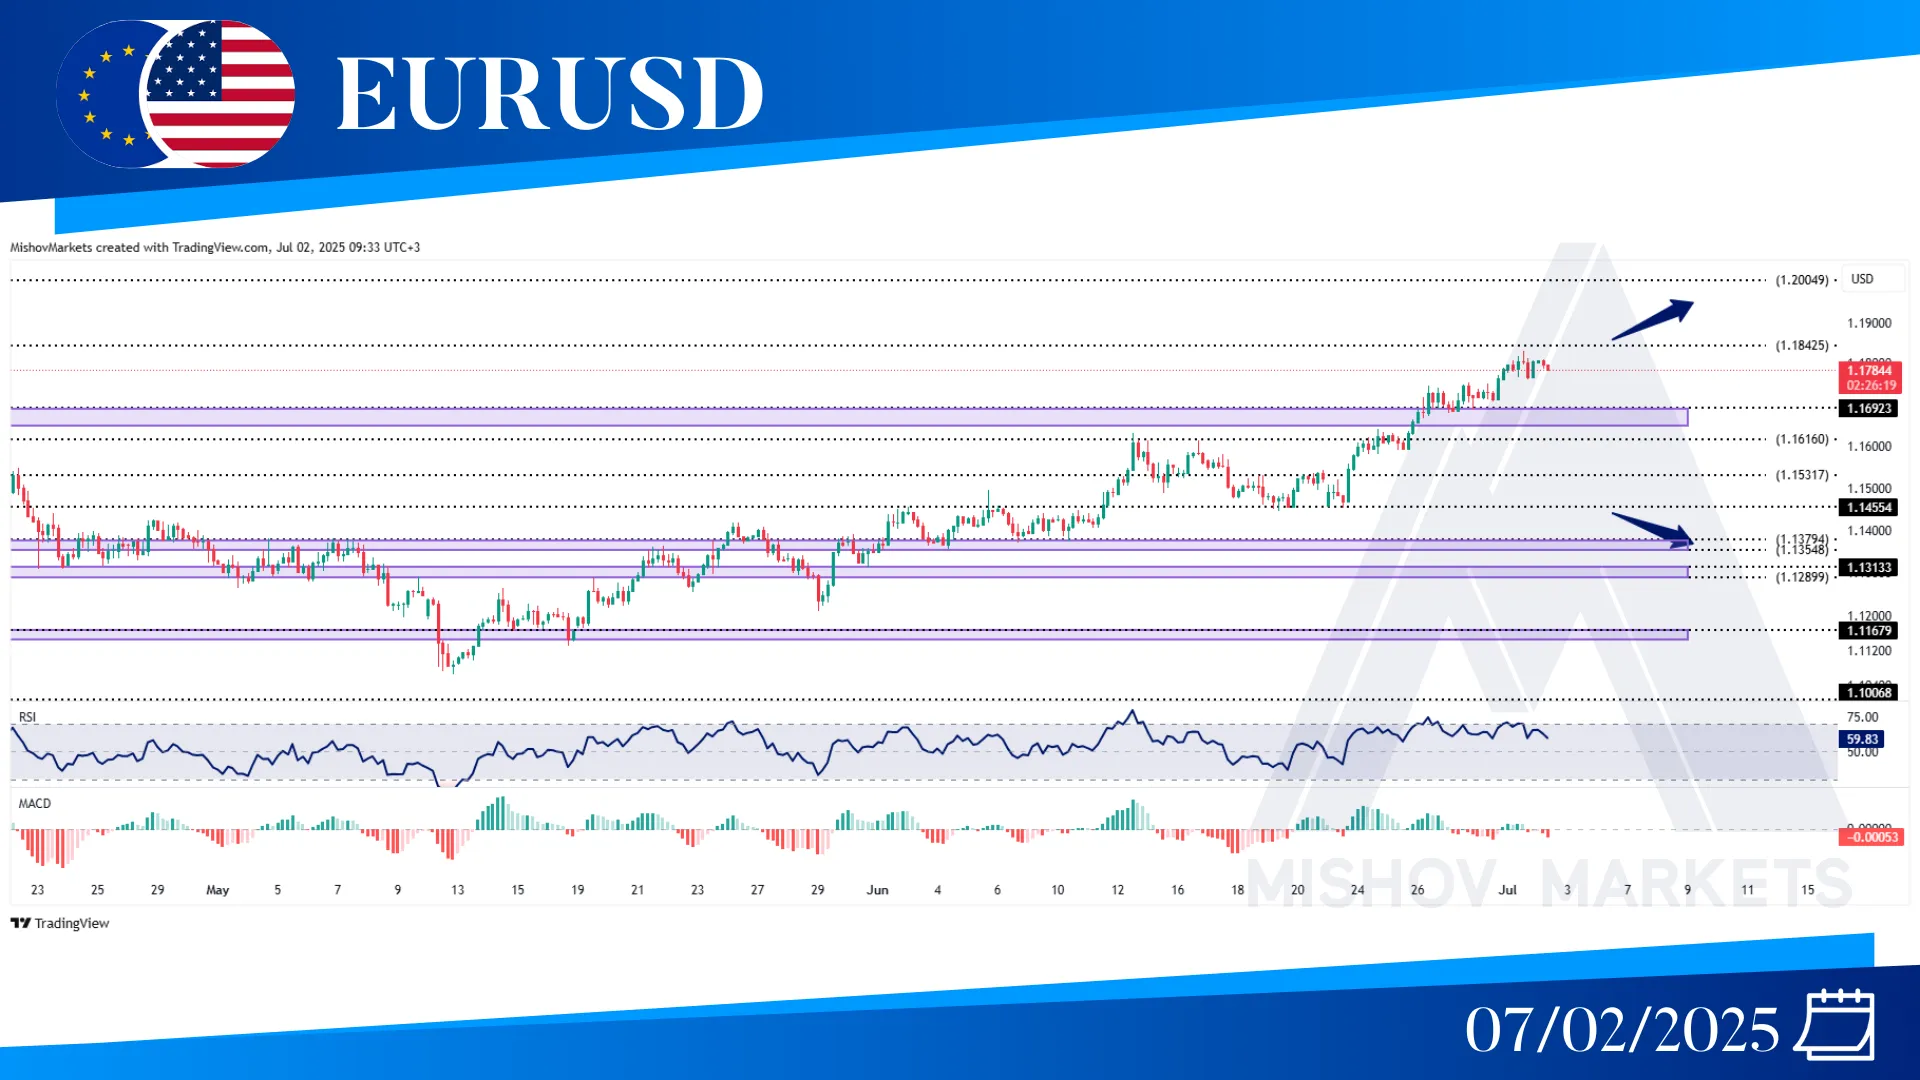
In EURUSD, as mentioned in Monday’s analysis, the price tested 1.16920-1.16460 and moved toward 1.18420. Now if the 1.18420 acts as resistance, then it could start to decrease and the price could come back to test the 1.16920-1.16460 or 1.15310-1.14550 zone before moving toward its bullish targets at 1.18420 and 1.20040. If this zone also fails to support the price, and it provides a price close below 1.14450, then it could decrease toward the 1.13540-1.13750 zone.
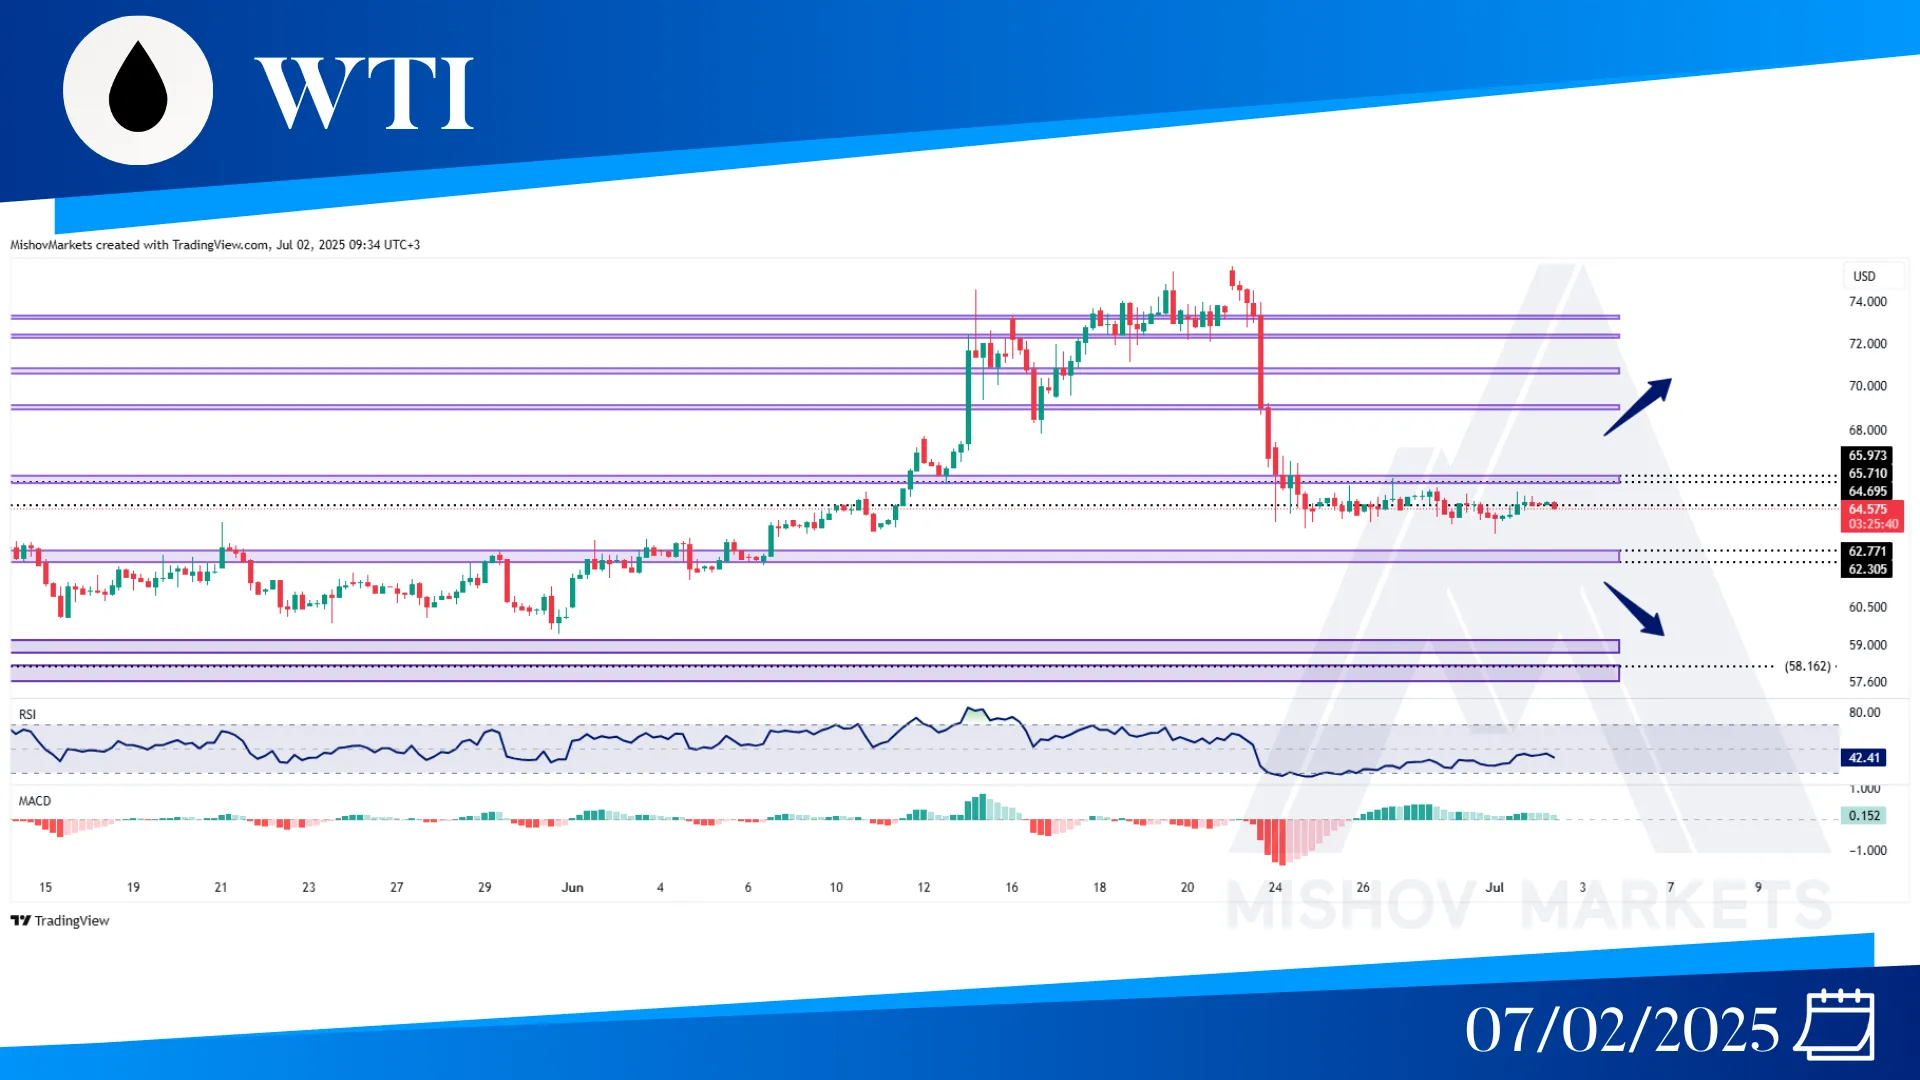
In WTI, the situation has remained unchanged since last week and Monday’s analysis; price is still trading in a range between 63.900 and 65.700. Now if the price breaks from above this trading range, then it could increase further toward 65.970, 68.360 and 70.690. But if the 63.900 zone fails to support the price and it provides a close below 63.400, it could decrease further toward 62.770-62.300 and 59.200-58.840.
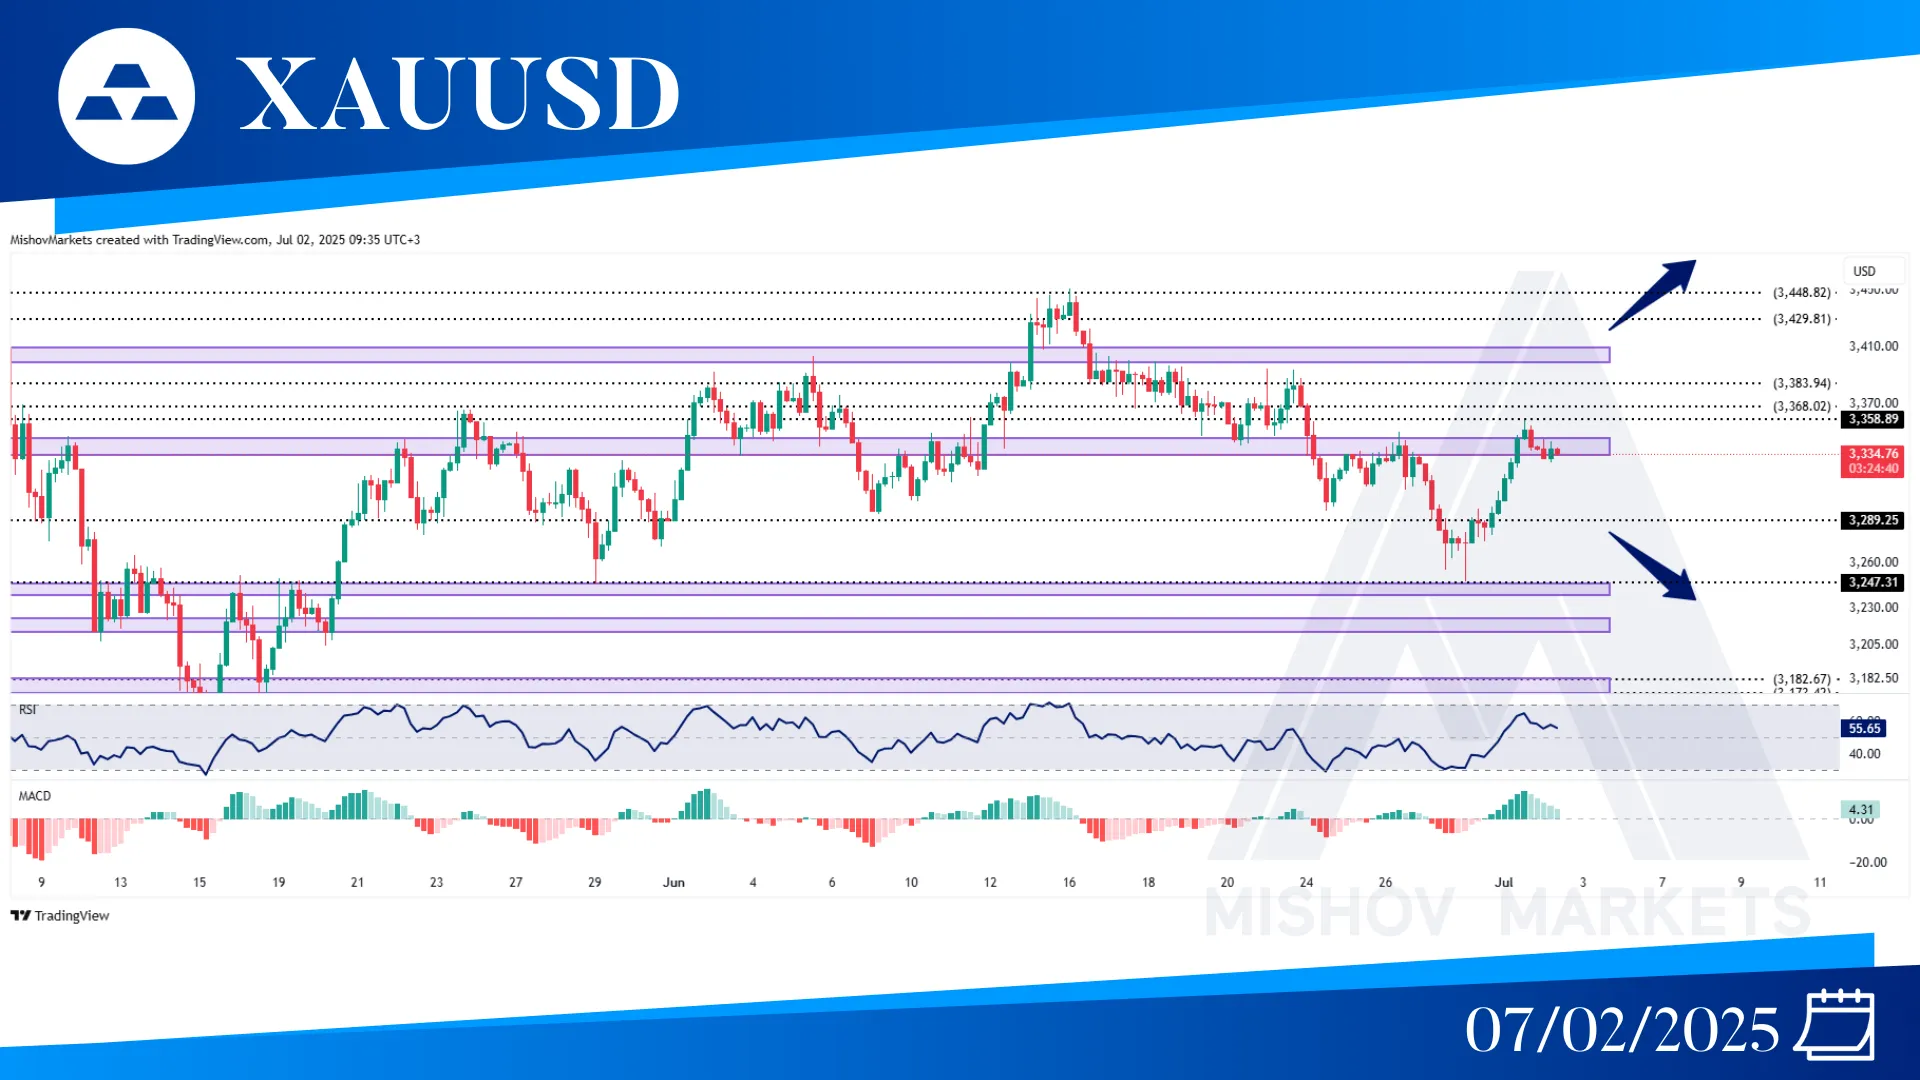
In XAUUSD, as precisely mentioned in Monday’s analysis, the 3291-3296 zone acted as support and pushed the price higher toward our targets at 3345-3334 and 3358. Now the 3358 zone has acted as resistance and pushed the price lower, and if the 3345-3334 zone fails to support the price, then it could decrease further toward 3289, 3247, 3224-3213, and 3182-3173. But if this zone acts as support and price continues to increase and break above 3358, it could reach our targets at 3368, 3384, 3398-3407, 3429, and 3448, 3492-3501.
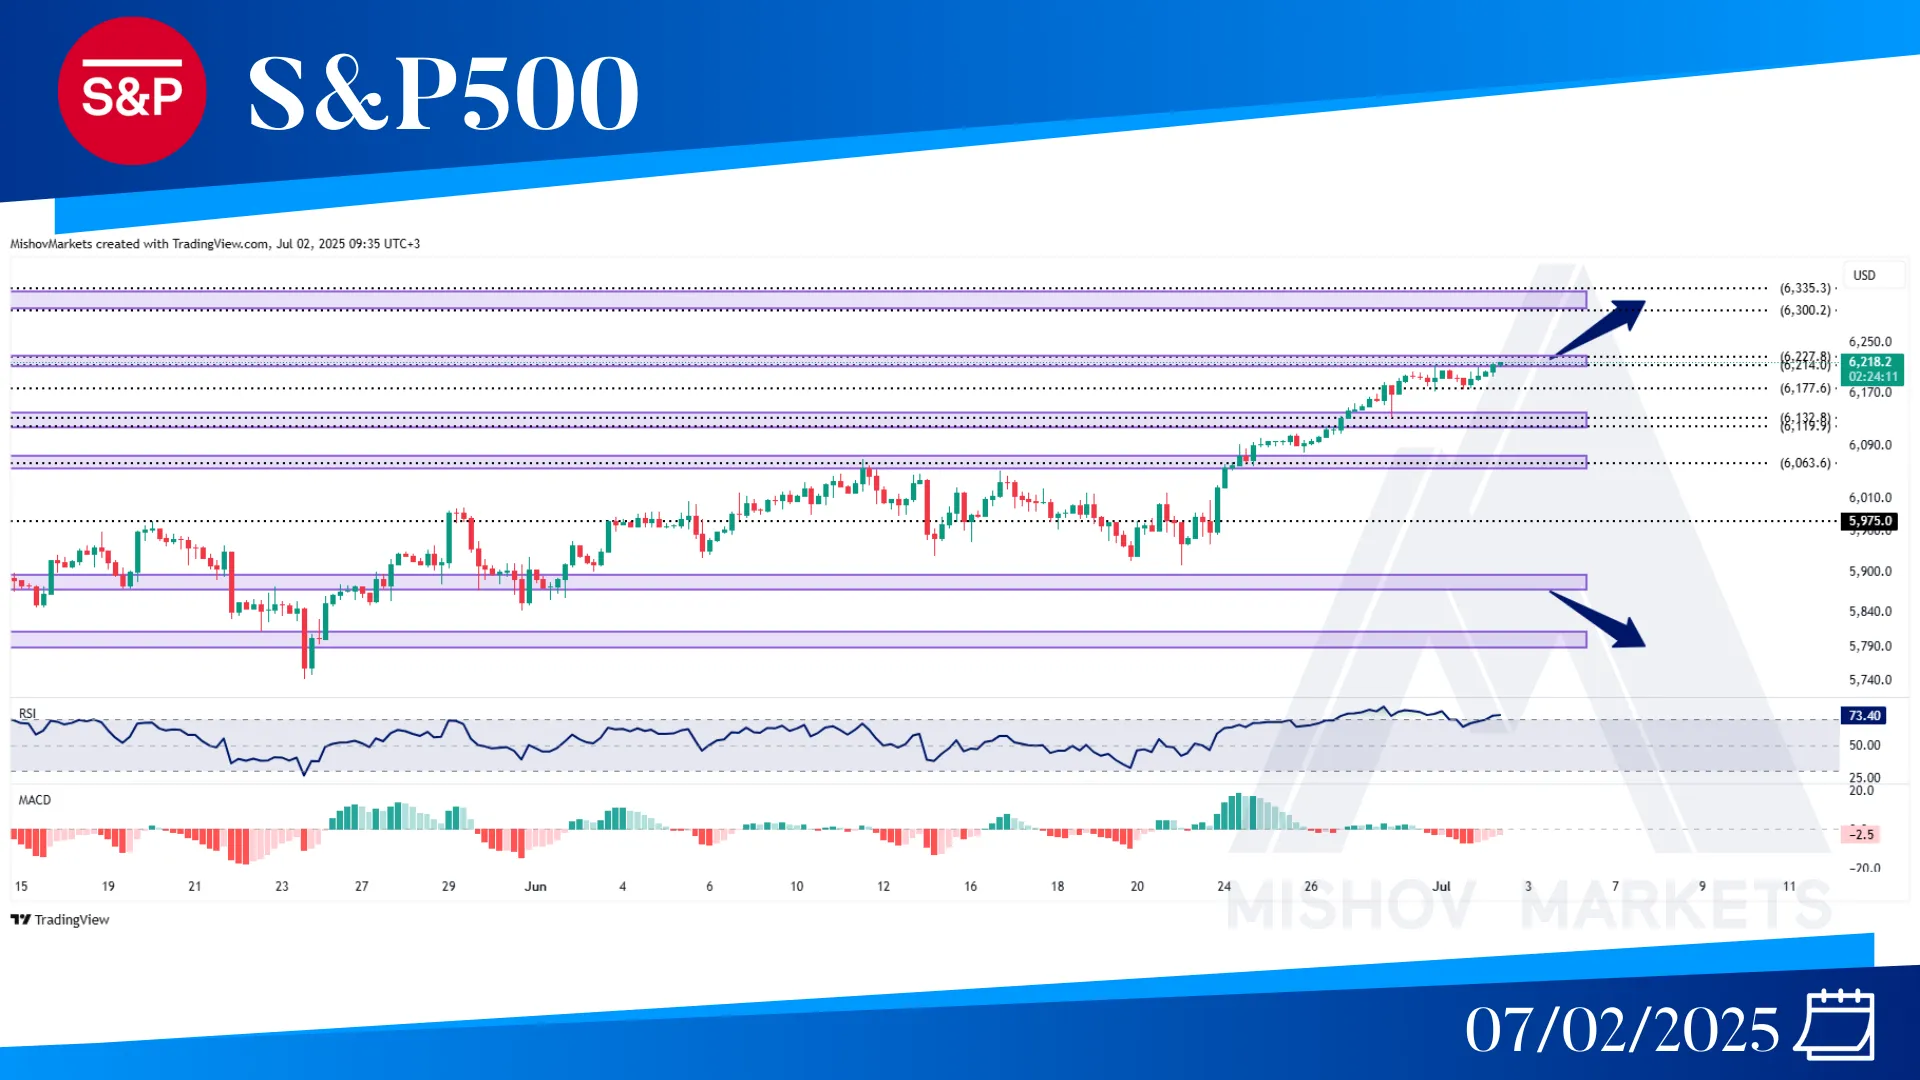
In the S&P 500, as precisely mentioned in Monday’s analysis, the price reached our target at 6214-6227 and faced a resistance and moved toward 6177 and received support from it and continued its bullish momentum toward the target at 6214-6227. Now the price could continue to move toward our bullish targets at 6300 and 6335, but if the 6214-6227 acts as a resistance, then it could decrease further to receive support from either of the 6177, 6132-6119, and 6063. But if these zones fail to support the price and it provides a close below 5975, then it could decrease toward the 5896–5875, 5815–5788, and 5690–5672 zones.
